## Scatter Plot with Marginal Distributions: High School Biology Confidence vs. Target Length
### Overview
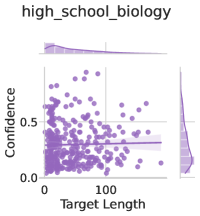
The image is a statistical visualization, specifically a scatter plot with marginal histograms/density plots, titled "high_school_biology". It displays the relationship between "Target Length" (x-axis) and "Confidence" (y-axis) for a dataset presumably related to high school biology. The plot uses a monochromatic purple color scheme.
### Components/Axes
* **Title/Header:** The text "high_school_biology" is displayed in the top-left corner, inside a light purple rectangular box, serving as both a title and a legend for the single data series.
* **Main Chart Area:**
* **X-Axis:** Labeled "Target Length". Major tick marks are visible at 0 and 100. The axis extends slightly beyond 100.
* **Y-Axis:** Labeled "Confidence". Major tick marks are visible at 0.0 and 0.5. The axis extends from 0.0 to approximately 0.7.
* **Data Series:** Represented by numerous semi-transparent purple circles (scatter points). A darker purple trend line (likely a regression line) is drawn through the data.
* **Marginal Distributions:**
* **Top Marginal Plot:** A histogram or density plot aligned with the x-axis ("Target Length"). It shows the distribution of the Target Length variable.
* **Right Marginal Plot:** A histogram or density plot aligned with the y-axis ("Confidence"). It shows the distribution of the Confidence variable.
### Detailed Analysis
* **Data Point Distribution:** The scatter points are densely clustered in the lower-left quadrant of the plot. The highest density appears for Target Length values between approximately 10 and 80, and Confidence values between 0.0 and 0.3.
* **Trend Line:** The dark purple trend line shows a clear, positive linear slope. It starts near a Confidence of ~0.1 at Target Length 0 and rises to a Confidence of ~0.3 at Target Length 150 (estimated).
* **Marginal Histogram Details:**
* **Target Length (Top):** The distribution is right-skewed. The highest frequency (tallest bar) is at the lower end of the scale (near 0-20). The frequency decreases as Target Length increases.
* **Confidence (Right):** The distribution is left-skewed. The highest frequency is at the lower end of the confidence scale (near 0.0-0.1). Frequency drops sharply as confidence increases towards 0.5 and above.
### Key Observations
1. **Positive Correlation:** There is a visible positive correlation between Target Length and Confidence. As Target Length increases, Confidence tends to increase, as confirmed by the upward-sloping trend line.
2. **Data Sparsity:** Data points become significantly sparser for Target Length values greater than ~100 and for Confidence values greater than ~0.4.
3. **Outliers:** A few data points exist with relatively high Confidence (>0.5) across various Target Lengths, but they are not the norm.
4. **Concentration:** The vast majority of the data is concentrated in the region of lower Target Length and lower Confidence.
### Interpretation
This chart suggests that within the context of "high_school_biology" (which could refer to model predictions, student assessments, or content analysis), there is a measurable, positive relationship between the length of a target (e.g., a text passage, a question, a concept) and the associated confidence metric. The data implies that longer targets are, on average, associated with higher confidence scores.
However, the right-skewed distribution of Target Length indicates that most targets in this dataset are relatively short. The strong left-skew of Confidence shows that low-confidence outcomes are far more common than high-confidence ones. The positive trend, while clear, operates within a low-confidence regime for the majority of cases. The sparsity of data at higher values means the trend's predictive power may be weaker in those regions. This could indicate that achieving high confidence in this domain is difficult, or that the system/model being measured is generally conservative in its confidence assignments, with length being one positive, but not sole, contributing factor.