## Step-Wise Loss vs Tokens(B) Charts
### Overview
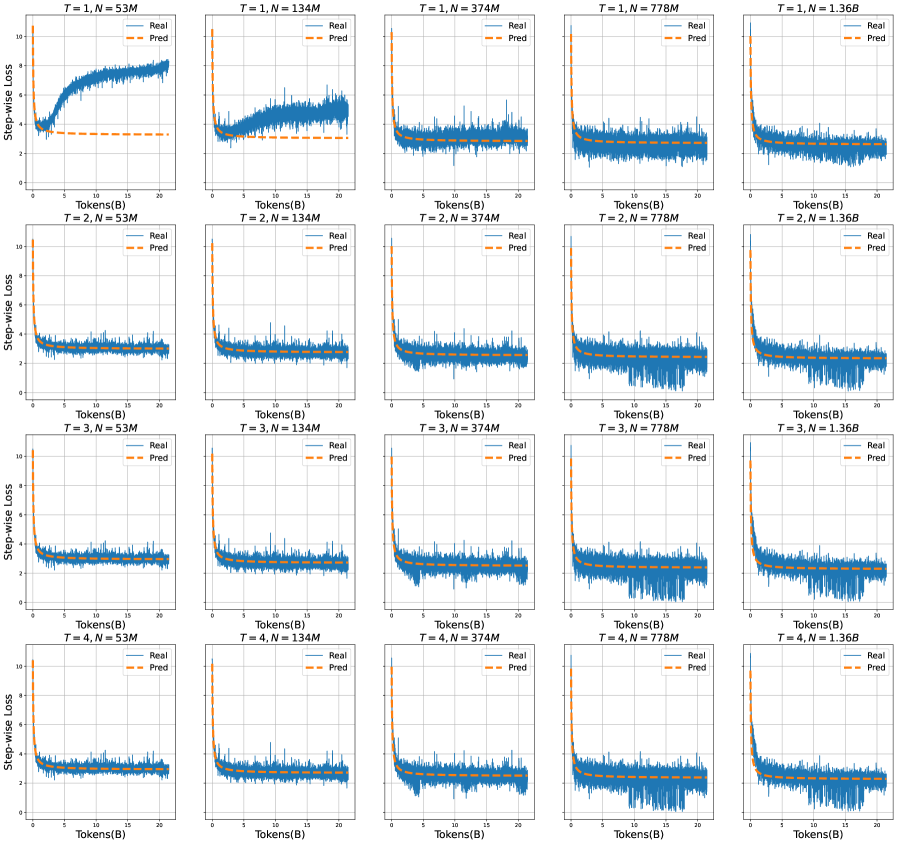
The image presents a grid of 20 line charts, arranged in a 4x5 matrix. Each chart displays the "Step-wise Loss" as a function of "Tokens(B)". The charts are grouped by two parameters: 'T' (ranging from 1 to 4) and 'N' (53M, 134M, 374M, 778M, 1.36B). Each chart contains two data series: "Real" (blue line) and "Pred" (dashed orange line). The charts illustrate how the step-wise loss changes with the number of tokens for different values of T and N.
### Components/Axes
* **Y-axis (Step-wise Loss):** Ranges from 0 to 10.
* **X-axis (Tokens(B)):** Ranges from 0 to 20.
* **Legend:** Located in the top-right corner of each chart, indicating "Real" (solid blue line) and "Pred" (dashed orange line).
* **Chart Titles:** Each chart has a title in the format "T = [value], N = [value]", where T ranges from 1 to 4 and N takes values 53M, 134M, 374M, 778M, and 1.36B.
### Detailed Analysis
**Row 1: T = 1**
* **T = 1, N = 53M:** The "Real" line starts around 2, increases sharply to approximately 8 around Tokens(B) = 5, and then fluctuates around 8. The "Pred" line is relatively flat at approximately 4.
* **T = 1, N = 134M:** The "Real" line starts around 4, decreases to approximately 2 around Tokens(B) = 5, and then fluctuates around 2. The "Pred" line is relatively flat at approximately 2.
* **T = 1, N = 374M:** The "Real" line starts around 2, decreases to approximately 1 around Tokens(B) = 5, and then fluctuates around 1. The "Pred" line is relatively flat at approximately 1.
* **T = 1, N = 778M:** The "Real" line starts around 1.5, decreases to approximately 0.5 around Tokens(B) = 5, and then fluctuates around 0.5. The "Pred" line is relatively flat at approximately 0.5.
* **T = 1, N = 1.36B:** The "Real" line starts around 1.5, decreases to approximately 0.5 around Tokens(B) = 5, and then fluctuates around 0.5. The "Pred" line is relatively flat at approximately 0.5.
**Row 2: T = 2**
* **T = 2, N = 53M:** The "Real" line fluctuates around 4. The "Pred" line is relatively flat at approximately 4.
* **T = 2, N = 134M:** The "Real" line starts around 4, decreases to approximately 1 around Tokens(B) = 5, and then fluctuates around 1. The "Pred" line is relatively flat at approximately 1.
* **T = 2, N = 374M:** The "Real" line starts around 2, decreases to approximately 0.5 around Tokens(B) = 5, and then fluctuates around 0.5. The "Pred" line is relatively flat at approximately 0.5.
* **T = 2, N = 778M:** The "Real" line starts around 1.5, decreases to approximately 0.5 around Tokens(B) = 5, and then fluctuates around 0.5. The "Pred" line is relatively flat at approximately 0.5.
* **T = 2, N = 1.36B:** The "Real" line starts around 1.5, decreases to approximately 0.5 around Tokens(B) = 5, and then fluctuates around 0.5. The "Pred" line is relatively flat at approximately 0.5.
**Row 3: T = 3**
* **T = 3, N = 53M:** The "Real" line fluctuates around 4. The "Pred" line is relatively flat at approximately 4.
* **T = 3, N = 134M:** The "Real" line starts around 4, decreases to approximately 1 around Tokens(B) = 5, and then fluctuates around 1. The "Pred" line is relatively flat at approximately 1.
* **T = 3, N = 374M:** The "Real" line starts around 2, decreases to approximately 0.5 around Tokens(B) = 5, and then fluctuates around 0.5. The "Pred" line is relatively flat at approximately 0.5.
* **T = 3, N = 778M:** The "Real" line starts around 1.5, decreases to approximately 0.5 around Tokens(B) = 5, and then fluctuates around 0.5. The "Pred" line is relatively flat at approximately 0.5.
* **T = 3, N = 1.36B:** The "Real" line starts around 1.5, decreases to approximately 0.5 around Tokens(B) = 5, and then fluctuates around 0.5. The "Pred" line is relatively flat at approximately 0.5.
**Row 4: T = 4**
* **T = 4, N = 53M:** The "Real" line fluctuates around 4. The "Pred" line is relatively flat at approximately 4.
* **T = 4, N = 134M:** The "Real" line starts around 4, decreases to approximately 1 around Tokens(B) = 5, and then fluctuates around 1. The "Pred" line is relatively flat at approximately 1.
* **T = 4, N = 374M:** The "Real" line starts around 2, decreases to approximately 0.5 around Tokens(B) = 5, and then fluctuates around 0.5. The "Pred" line is relatively flat at approximately 0.5.
* **T = 4, N = 778M:** The "Real" line starts around 1.5, decreases to approximately 0.5 around Tokens(B) = 5, and then fluctuates around 0.5. The "Pred" line is relatively flat at approximately 0.5.
* **T = 4, N = 1.36B:** The "Real" line starts around 1.5, decreases to approximately 0.5 around Tokens(B) = 5, and then fluctuates around 0.5. The "Pred" line is relatively flat at approximately 0.5.
### Key Observations
* For N = 53M, the "Real" line fluctuates significantly, and the "Pred" line remains relatively constant.
* For N = 134M, 374M, 778M, and 1.36B, the "Real" line generally decreases as Tokens(B) increases, and then stabilizes. The "Pred" line remains relatively constant.
* As N increases, the "Real" line tends to decrease and stabilize at a lower value.
* The "Pred" line generally remains constant for a given N, regardless of the value of Tokens(B).
### Interpretation
The charts likely represent the training process of a machine learning model, where "Real" represents the actual loss and "Pred" represents the predicted loss. The parameter 'T' could represent the training epoch, and 'N' could represent the size of the training dataset.
The data suggests that:
* Increasing the size of the training dataset (N) generally leads to a lower and more stable "Real" loss.
* The model's predictions ("Pred") are not effectively capturing the fluctuations in the "Real" loss, especially for smaller datasets (N = 53M).
* As the training progresses (increasing T), the "Real" loss tends to decrease and stabilize, indicating that the model is learning.
* The model seems to perform better (lower loss) with larger datasets (N = 374M, 778M, 1.36B) compared to smaller datasets (N = 53M, 134M).
The discrepancy between the "Real" and "Pred" lines suggests that the model may need further tuning or a different architecture to better capture the underlying patterns in the data. The initial increase in loss for T=1, N=53M suggests the model is initially diverging before converging.