TECHNICAL ASSET FINGERPRINT
1b00925c85d6a65a78d70e96
Click to view fullscreen
Press ESC or click to close
FOUND IN PAPERS
EXPERT: gemma-3-27b-it-free VERSION 1
RUNTIME: google-free/gemma-3-27b-it
INTEL_VERIFIED
\n
## Line Chart: Step-wise Loss vs. Tokens (B) for Various T and N Values
### Overview
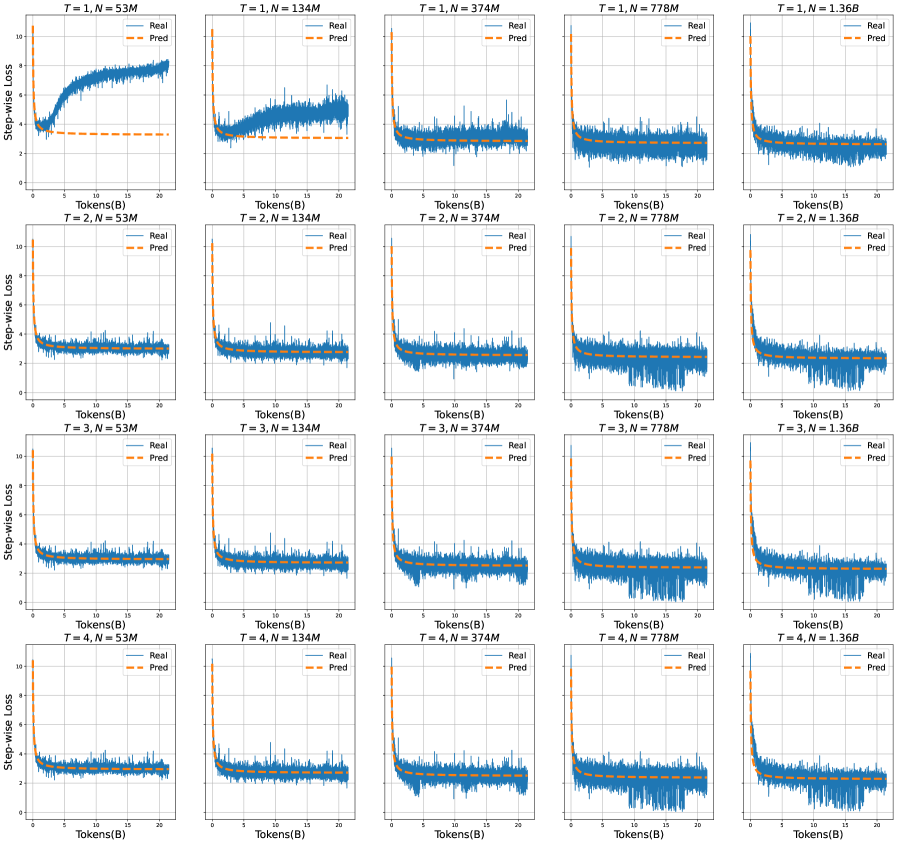
The image presents a 4x5 grid of line charts, each depicting the relationship between Step-wise Loss (y-axis) and Tokens (B) (x-axis). Each chart corresponds to a specific combination of parameters 'T' and 'N', indicated in the chart title. Two lines are plotted on each chart: 'Real' (solid blue line) and 'Pred' (dashed orange line), representing the loss for the real and predicted values, respectively. A shaded region around each line indicates the standard deviation.
### Components/Axes
* **X-axis:** Tokens (B), ranging from approximately 0 to 25.
* **Y-axis:** Step-wise Loss, ranging from approximately 0 to 10.
* **Lines:**
* 'Real' (solid blue line) - Represents the loss for the real values.
* 'Pred' (dashed orange line) - Represents the loss for the predicted values.
* **Legend:** Located in the top-left corner of each chart, identifying the 'Real' and 'Pred' lines.
* **Titles:** Each chart is titled "T = [value], N = [value]", indicating the specific values of parameters T and N for that chart.
* **Shaded Regions:** Represent the standard deviation around each line.
### Detailed Analysis or Content Details
The charts are arranged in a grid as follows:
* **Row 1 (T = 1):**
* N = 53M: The 'Real' line starts around 8, decreases rapidly to approximately 1.5, and then fluctuates around 1.5. The 'Pred' line starts around 2, decreases to approximately 1, and fluctuates around 1.
* N = 134M: The 'Real' line starts around 8, decreases rapidly to approximately 1.5, and then fluctuates around 1.5. The 'Pred' line starts around 2, decreases to approximately 1, and fluctuates around 1.
* N = 374M: The 'Real' line starts around 8, decreases rapidly to approximately 1.5, and then fluctuates around 1.5. The 'Pred' line starts around 2, decreases to approximately 1, and fluctuates around 1.
* N = 778M: The 'Real' line starts around 8, decreases rapidly to approximately 1.5, and then fluctuates around 1.5. The 'Pred' line starts around 2, decreases to approximately 1, and fluctuates around 1.
* N = 1.368B: The 'Real' line starts around 8, decreases rapidly to approximately 1.5, and then fluctuates around 1.5. The 'Pred' line starts around 2, decreases to approximately 1, and fluctuates around 1.
* **Row 2 (T = 2):**
* N = 53M: The 'Real' line starts around 8, decreases rapidly to approximately 1.5, and then fluctuates around 1.5. The 'Pred' line starts around 2, decreases to approximately 1, and fluctuates around 1.
* N = 134M: The 'Real' line starts around 8, decreases rapidly to approximately 1.5, and then fluctuates around 1.5. The 'Pred' line starts around 2, decreases to approximately 1, and fluctuates around 1.
* N = 374M: The 'Real' line starts around 8, decreases rapidly to approximately 1.5, and then fluctuates around 1.5. The 'Pred' line starts around 2, decreases to approximately 1, and fluctuates around 1.
* N = 778M: The 'Real' line starts around 8, decreases rapidly to approximately 1.5, and then fluctuates around 1.5. The 'Pred' line starts around 2, decreases to approximately 1, and fluctuates around 1.
* N = 1.368B: The 'Real' line starts around 8, decreases rapidly to approximately 1.5, and then fluctuates around 1.5. The 'Pred' line starts around 2, decreases to approximately 1, and fluctuates around 1.
* **Row 3 (T = 3):**
* N = 53M: The 'Real' line starts around 8, decreases rapidly to approximately 1.5, and then fluctuates around 1.5. The 'Pred' line starts around 2, decreases to approximately 1, and fluctuates around 1.
* N = 134M: The 'Real' line starts around 8, decreases rapidly to approximately 1.5, and then fluctuates around 1.5. The 'Pred' line starts around 2, decreases to approximately 1, and fluctuates around 1.
* N = 374M: The 'Real' line starts around 8, decreases rapidly to approximately 1.5, and then fluctuates around 1.5. The 'Pred' line starts around 2, decreases to approximately 1, and fluctuates around 1.
* N = 778M: The 'Real' line starts around 8, decreases rapidly to approximately 1.5, and then fluctuates around 1.5. The 'Pred' line starts around 2, decreases to approximately 1, and fluctuates around 1.
* N = 1.368B: The 'Real' line starts around 8, decreases rapidly to approximately 1.5, and then fluctuates around 1.5. The 'Pred' line starts around 2, decreases to approximately 1, and fluctuates around 1.
* **Row 4 (T = 4):**
* N = 53M: The 'Real' line starts around 8, decreases rapidly to approximately 1.5, and then fluctuates around 1.5. The 'Pred' line starts around 2, decreases to approximately 1, and fluctuates around 1.
* N = 134M: The 'Real' line starts around 8, decreases rapidly to approximately 1.5, and then fluctuates around 1.5. The 'Pred' line starts around 2, decreases to approximately 1, and fluctuates around 1.
* N = 374M: The 'Real' line starts around 8, decreases rapidly to approximately 1.5, and then fluctuates around 1.5. The 'Pred' line starts around 2, decreases to approximately 1, and fluctuates around 1.
* N = 778M: The 'Real' line starts around 8, decreases rapidly to approximately 1.5, and then fluctuates around 1.5. The 'Pred' line starts around 2, decreases to approximately 1, and fluctuates around 1.
* N = 1.368B: The 'Real' line starts around 8, decreases rapidly to approximately 1.5, and then fluctuates around 1.5. The 'Pred' line starts around 2, decreases to approximately 1, and fluctuates around 1.
### Key Observations
* The 'Real' and 'Pred' lines exhibit very similar behavior across all charts.
* The loss decreases rapidly with increasing tokens (B) and then stabilizes.
* The shaded regions indicate relatively small standard deviations, suggesting consistent performance.
* There is no apparent significant difference in performance across different values of T and N.
### Interpretation
The data suggests that the model performs consistently well across a range of T and N values. The rapid decrease in loss followed by stabilization indicates that the model learns effectively as the number of tokens increases. The close proximity of the 'Real' and 'Pred' lines suggests that the predicted loss accurately reflects the actual loss. The small standard deviations indicate that the model's performance is reliable. The lack of significant variation across different T and N values suggests that the model is relatively robust to changes in these parameters. This could indicate a well-trained model that generalizes well to different datasets or configurations. The consistent behavior across all charts suggests a stable learning process.
DECODING INTELLIGENCE...