## Comparative Analysis of Agent Performance in a Difficult Setup
### Overview
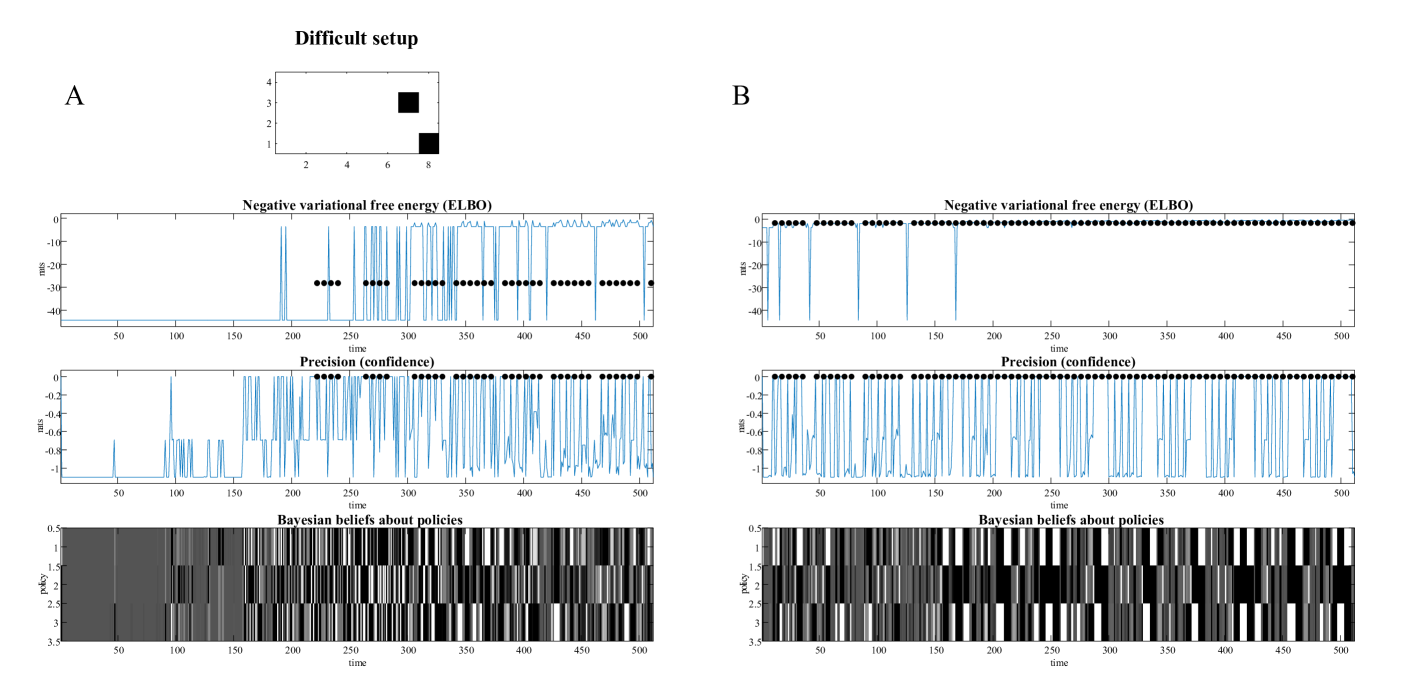
The image presents a comparative analysis of an agent's performance in a "Difficult setup" under two conditions, labeled A and B. Each condition is represented by three plots: Negative variational free energy (ELBO), Precision (confidence), and Bayesian beliefs about policies, all plotted against time. The setup is visualized as a small grid with two black squares representing obstacles.
### Components/Axes
**Top Row: Setup Visualization**
* **Title:** Difficult setup
* **Grid:** A 4x8 grid.
* **Obstacles:** Two black squares, one at approximately (6,4) and the other at approximately (8,1).
* **Labels:** A and B, indicating two different conditions or agents.
**Middle Rows: Condition A (Left) and Condition B (Right)**
* **Plot 1: Negative variational free energy (ELBO)**
* **Y-axis:** "nts", ranging from -40 to 0, with markers at -10, -20, -30, and -40.
* **X-axis:** "time", ranging from 0 to 500, with markers every 50 units.
* **Data:** A blue line representing the ELBO over time. Black dots are overlaid on the line at certain points.
* **Plot 2: Precision (confidence)**
* **Y-axis:** "nts", ranging from -1 to 0, with markers at -0.2, -0.4, -0.6, -0.8, and -1.
* **X-axis:** "time", ranging from 0 to 500, with markers every 50 units.
* **Data:** A blue line representing the precision/confidence over time. Black dots are overlaid on the line at certain points.
* **Plot 3: Bayesian beliefs about policies**
* **Y-axis:** "policy", ranging from 0.5 to 3.5, with markers at 1, 2, 2.5, and 3.
* **X-axis:** "time", ranging from 0 to 500, with markers every 50 units.
* **Data:** A heatmap-like representation of policy beliefs, with varying shades of gray indicating different belief levels.
### Detailed Analysis
**Condition A**
* **Negative variational free energy (ELBO):**
* The blue line starts at approximately -40 nts and remains there until around time = 200.
* Between time = 200 and 300, the line fluctuates between -40 and 0 nts.
* From time = 300 to 500, the line fluctuates more frequently between -40 and 0 nts.
* Black dots are present on the line between time = 225 and 325, indicating a value of approximately -27 nts.
* **Precision (confidence):**
* The blue line starts at approximately -1 nts and fluctuates until around time = 200.
* Between time = 200 and 500, the line fluctuates more frequently between -1 and 0 nts.
* Black dots are present on the line between time = 225 and 500, indicating a value of approximately 0 nts.
* **Bayesian beliefs about policies:**
* The heatmap shows a mix of gray shades, indicating varying beliefs about different policies.
* Before time = 150, the policies are mostly uniform.
* After time = 150, there are clear vertical stripes, indicating distinct policy preferences at different times.
**Condition B**
* **Negative variational free energy (ELBO):**
* The blue line fluctuates between -40 and 0 nts throughout the entire time range.
* Black dots are present on the line between time = 0 and 500, indicating a value of approximately 0 nts.
* **Precision (confidence):**
* The blue line fluctuates between -1 and 0 nts throughout the entire time range.
* Black dots are present on the line between time = 0 and 500, indicating a value of approximately 0 nts.
* **Bayesian beliefs about policies:**
* The heatmap shows a mix of gray shades, indicating varying beliefs about different policies.
* There are clear vertical stripes, indicating distinct policy preferences at different times.
### Key Observations
* **ELBO:** In Condition A, the ELBO initially remains low and then starts fluctuating, while in Condition B, it fluctuates throughout the entire time range.
* **Precision:** In Condition A, the precision initially fluctuates and then starts fluctuating more frequently, while in Condition B, it fluctuates throughout the entire time range.
* **Policy Beliefs:** Both conditions show varying policy preferences over time, but the patterns differ.
* **Black Dots:** The black dots seem to indicate specific events or states where certain values are achieved.
### Interpretation
The data suggests that the agent in Condition A initially struggles to find an optimal policy, as indicated by the low ELBO and fluctuating precision. Over time, it starts to explore different policies, leading to increased ELBO and precision fluctuations. In contrast, the agent in Condition B seems to be exploring different policies from the beginning, resulting in continuous fluctuations in ELBO and precision. The Bayesian beliefs about policies provide insights into the specific policies being considered at different times. The black dots may indicate moments of high confidence or successful policy execution. The "Difficult setup" likely refers to a challenging environment that requires the agent to adapt its policy over time.