\n
## Chart: Comparison of Difficult Setup (A & B) - Variational Free Energy, Precision, and Bayesian Beliefs
### Overview
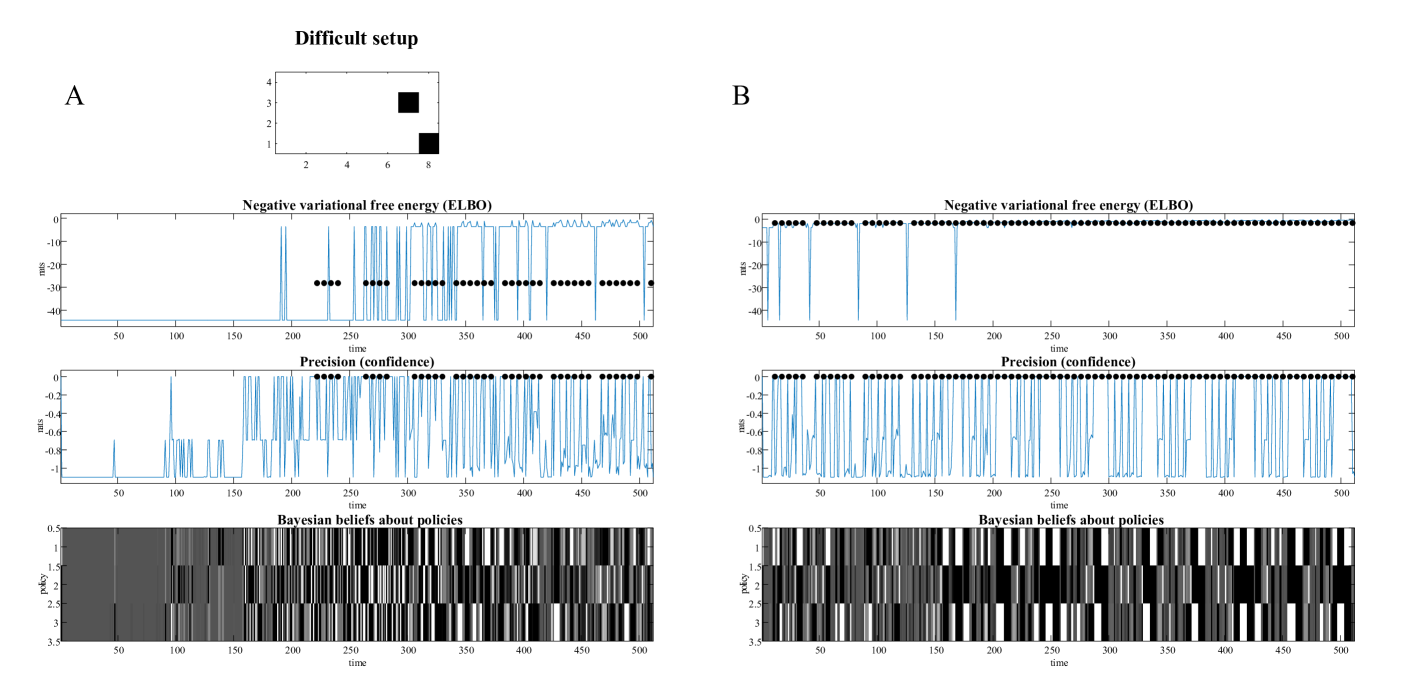
The image presents a comparative analysis of two setups, labeled 'A' and 'B', under a "Difficult setup" condition. Each setup is visualized through three sub-charts: Negative variational free energy (ELBO), Precision (confidence), and Bayesian beliefs about policies. The charts display data over a time course from 0 to 500. Setup A includes a small 2x2 grid in the top-left corner, while setup B does not.
### Components/Axes
Each setup (A and B) contains three identical sub-charts stacked vertically.
* **X-axis (all sub-charts):** Time, ranging from 0 to 500, with increments of 50. Labeled as "time".
* **Y-axis (Negative variational free energy):** Units are "bits". Scale ranges from -40 to 0, with increments of 10. Labeled as "Negative variational free energy (ELBO)".
* **Y-axis (Precision):** Units are "bits". Scale ranges from -0.5 to 0.5, with increments of 0.1. Labeled as "Precision (confidence)".
* **Y-axis (Bayesian beliefs):** Labeled as "policy". Scale ranges from 0.5 to 3.5, with increments of 0.5.
* **Top-left corner of A:** A 2x2 grid with values ranging from 1 to 4.
### Detailed Analysis or Content Details
**Setup A:**
* **Negative variational free energy (ELBO):** The line starts around -10 bits at time 0, fluctuates significantly between approximately -10 and -30 bits until around time 200. After time 200, the line stabilizes, oscillating around -10 bits with smaller fluctuations. There are several black dots scattered along the line, appearing at irregular intervals.
* **Precision (confidence):** The line fluctuates rapidly around 0 bits from time 0 to 200, with values ranging from approximately -0.4 to 0.4. After time 200, the fluctuations become less pronounced, and the line generally remains closer to 0 bits, with occasional spikes.
* **Bayesian beliefs about policies:** This chart displays a heatmap-like representation. The x-axis represents time, and the y-axis represents policy (0.5 to 3.5). The intensity of the gray shading indicates the belief level. From time 0 to 200, the chart shows a relatively uniform distribution of gray shading, indicating a broad range of beliefs across policies. After time 200, the shading becomes more concentrated, with darker regions appearing at policy values of approximately 1.5 and 2.5, indicating stronger beliefs in those policies.
**Setup B:**
* **Negative variational free energy (ELBO):** The line starts around -10 bits at time 0 and remains relatively stable around this value until approximately time 250. After time 250, the line exhibits more significant fluctuations, ranging from -10 to -30 bits, before returning to a stable state around -10 bits after time 400. Black dots are scattered along the line, similar to Setup A.
* **Precision (confidence):** The line fluctuates around 0 bits from time 0 to 250, with values ranging from approximately -0.4 to 0.4. After time 250, the fluctuations become more pronounced, with larger spikes and dips, before returning to a more stable state around 0 bits after time 400.
* **Bayesian beliefs about policies:** Similar to Setup A, this chart displays a heatmap-like representation. From time 0 to 250, the chart shows a relatively uniform distribution of gray shading. After time 250, the shading becomes more concentrated, with darker regions appearing at policy values of approximately 1.5 and 2.5, indicating stronger beliefs in those policies.
### Key Observations
* Both setups exhibit similar patterns in all three sub-charts, but the timing of the fluctuations differs.
* Setup A shows earlier stabilization in ELBO and Precision compared to Setup B.
* The Bayesian beliefs charts in both setups show a transition from a broad distribution of beliefs to a more concentrated distribution around policies 1.5 and 2.5 after time 200 (A) or 250 (B).
* The black dots in the ELBO charts appear to be markers for specific events or time points.
### Interpretation
The data suggests that both setups are learning and converging towards a stable state, as evidenced by the stabilization of the ELBO and Precision metrics. The differences in timing between the setups indicate that Setup A may be learning faster or more efficiently than Setup B. The concentration of Bayesian beliefs around specific policies suggests that the agent is narrowing down its options and focusing on a subset of policies that it believes are most effective. The fluctuations in ELBO and Precision likely represent periods of exploration and exploitation, where the agent is trying out different policies and updating its beliefs based on the outcomes. The black dots in the ELBO charts could represent significant events or transitions in the learning process. The 2x2 grid in setup A may represent initial conditions or parameters that influence the learning dynamics. The overall trend indicates a successful learning process, with the agent gradually improving its performance and refining its beliefs over time.