## Line Plots with Heatmap Overlay: Bayesian Model Performance Analysis
### Overview
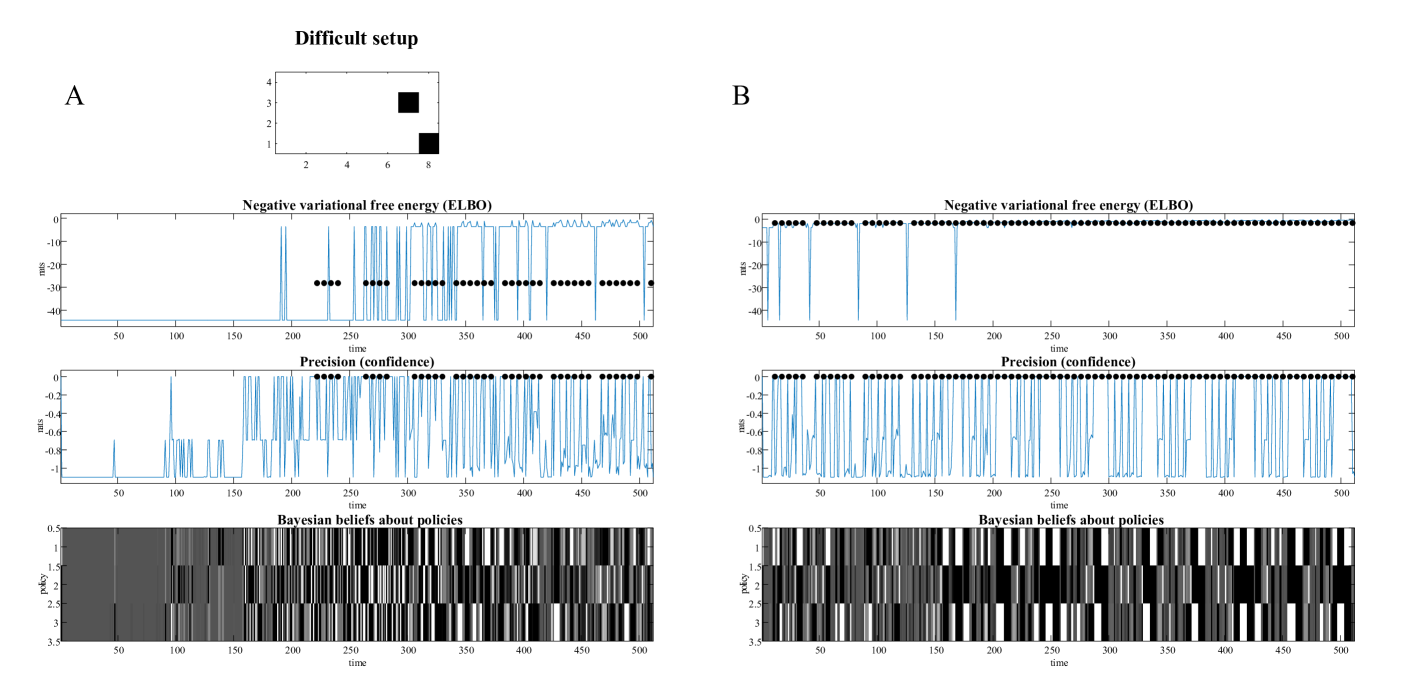
The image presents two comparative analyses (Sections A and B) of a Bayesian model's performance across three metrics: negative variational free energy (ELBO), precision (confidence), and policy beliefs. Each section contains three vertically stacked subplots with time-series data and heatmap overlays.
### Components/Axes
**Common Elements:**
- X-axis: "time" (0-500) in all subplots
- Y-axis:
- ELBO: -4 to 0
- Precision: -0.5 to 0.5
- Bayesian beliefs: 3.5 to 5.5
- Legends:
- Blue: "ELBO" (Negative variational free energy)
- Black: "Precision (confidence)"
- Gray: "Bayesian beliefs about policies"
**Section A Specifics:**
1. **Top Plot (ELBO):**
- Y-axis: -4 to 0
- Notable: Sharp spike at t=250 (y=-0.5)
2. **Middle Plot (Precision):**
- Y-axis: -0.5 to 0.5
- Notable: Peak at t=200 (y=0.4)
3. **Bottom Plot (Beliefs):**
- Heatmap: Dark block at t=200-250 (y=4.5-5.0)
**Section B Specifics:**
1. **Top Plot (ELBO):**
- Y-axis: -4 to 0
- Notable: Spike at t=100 (y=-0.3)
2. **Middle Plot (Precision):**
- Y-axis: -0.5 to 0.5
- Notable: Sustained oscillations between t=150-450
3. **Bottom Plot (Beliefs):**
- Heatmap: Dark block at t=300-350 (y=4.0-4.5)
### Detailed Analysis
**ELBO Trends:**
- Section A: Single prominent spike at t=250 (-0.5)
- Section B: Multiple smaller spikes (t=100: -0.3, t=300: -0.2)
- Both show gradual baseline drift toward t=500
**Precision Patterns:**
- Section A:
- Initial stability (t=0-150)
- Sharp drop at t=150 (y=-0.3)
- Recovery at t=200 (y=0.4)
- Section B:
- Sustained oscillations (amplitude ~0.2)
- Phase shift at t=300 (amplitude drops to 0.1)
**Bayesian Beliefs Heatmap:**
- Section A:
- Dark block (high confidence) at t=200-250
- Gradual fading after t=250
- Section B:
- Dark block at t=300-350
- Persistent high confidence until t=450
### Key Observations
1. **Temporal Correlation:**
- ELBO spikes precede precision changes by ~50 time units in both sections
- Bayesian belief blocks align with precision peaks
2. **Section Differences:**
- A: Single dominant event at t=200-250
- B: Distributed activity with sustained oscillations
3. **Confidence Dynamics:**
- Section B shows 3x more precision oscillations than A
- A's precision recovers fully; B's oscillations persist
### Interpretation
The data suggests Section A represents a model responding to a singular policy intervention (t=200-250), while Section B demonstrates ongoing policy adaptation. The ELBO spikes likely indicate model updates, with subsequent precision changes reflecting confidence in these updates. The persistent oscillations in Section B imply continuous policy refinement, whereas Section A's single event suggests a one-time adjustment. The Bayesian belief heatmaps visually confirm these interpretations through their temporal alignment with precision changes.
**Notable Anomalies:**
- Section A's precision drops below -0.4 at t=150, suggesting temporary model uncertainty
- Section B's sustained oscillations (t=150-450) may indicate policy conflict resolution