## Diagram: Social Grouping
### Overview
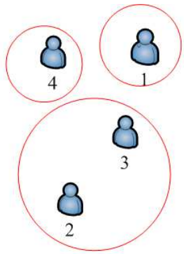
The image depicts a diagram showing social groupings of individuals. Each individual is represented by a blue icon of a person, and groups are indicated by red circles enclosing one or more individuals. There are four individuals labeled 1 through 4, grouped into three distinct circles.
### Components/Axes
* **Individuals:** Represented by blue person icons, labeled 1, 2, 3, and 4.
* **Groups:** Represented by red circles enclosing individuals.
* **Labels:** Numerical labels (1, 2, 3, 4) are placed near each individual icon.
### Detailed Analysis
* **Individual 1:** Located in the top-right, enclosed in a small red circle.
* **Individual 2:** Located in the bottom-left, enclosed in a large red circle.
* **Individual 3:** Located in the center, enclosed in the same large red circle as Individual 2.
* **Individual 4:** Located in the top-left, enclosed in a small red circle.
### Key Observations
* Individuals 2 and 3 are grouped together in a larger circle.
* Individuals 1 and 4 are each in their own separate, smaller circles.
* The circles do not overlap.
### Interpretation
The diagram illustrates a scenario where individuals 2 and 3 form a social group, while individuals 1 and 4 are isolated in their own separate groups. This could represent different social dynamics or relationships between the individuals. The size of the circles might indicate the strength or scope of the social group, with the larger circle suggesting a more significant or inclusive group.