\n
## Diagram: Grouping of Individuals
### Overview
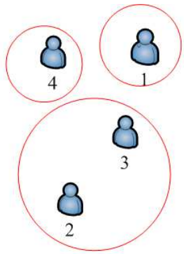
The image depicts a diagram showing three groups of individuals, represented by blue figures enclosed within red circles. Each individual within the groups is numbered from 1 to 4. The circles vary in size, suggesting potential differences in group size or importance.
### Components/Axes
The diagram consists of:
* **Circles:** Three red circles of varying sizes.
* **Individuals:** Four blue figures representing individuals.
* **Numbers:** Labels 1, 2, 3, and 4 identifying each individual.
### Detailed Analysis or Content Details
* **Group 1:** Contains one individual labeled "1". The circle enclosing this individual is relatively small.
* **Group 2:** Contains two individuals labeled "2" and "3". The circle enclosing these individuals is the largest of the three.
* **Group 3:** Contains one individual labeled "4". The circle enclosing this individual is medium-sized.
### Key Observations
The diagram highlights a difference in group sizes. Group 2 has the most members (two), while Groups 1 and 3 each have only one member. The size of the circles appears to correlate with the number of individuals they contain.
### Interpretation
The diagram likely represents a grouping or categorization of individuals. The varying group sizes could indicate different levels of representation, influence, or importance. The diagram does not provide any specific data or quantitative information beyond the number of individuals in each group. It is a visual representation of a simple grouping structure. The diagram could be used to illustrate concepts like teams, clusters, or categories. Without further context, the specific meaning of the grouping remains open to interpretation.