## Diagram: Grouped Entity Distribution
### Overview
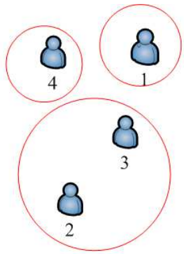
The image depicts a simple diagram with three red-outlined circles containing blue human figure icons. Each circle contains a single numerical label (1, 2, 3, 4) positioned near the corresponding figure. The arrangement suggests a categorical or hierarchical relationship between the entities.
### Components/Axes
- **Circles**:
- Two small circles positioned at the top (left and right)
- One large circle positioned at the bottom
- **Human Figures**:
- Four blue icons distributed across the circles
- Each figure is paired with a black numerical label
- **Labels**:
- Top-left circle: "4"
- Top-right circle: "1"
- Bottom circle: "2" (left figure) and "3" (right figure)
### Detailed Analysis
- **Top-left Circle**: Contains one figure labeled "4"
- **Top-right Circle**: Contains one figure labeled "1"
- **Bottom Circle**: Contains two figures labeled "2" and "3"
- **Spatial Relationships**:
- Top circles are smaller and positioned above the larger bottom circle
- Bottom circle's figures are horizontally separated (left/right)
- **Color Coding**:
- Circles: Red outlines
- Figures: Blue icons
- Labels: Black text
### Key Observations
1. The diagram uses numerical labels (1-4) to identify distinct entities
2. The bottom circle contains two entities (2 and 3), while top circles contain one each
3. No explicit connections (lines/overlaps) between circles suggest independent groupings
4. Numerical sequence (1,2,3,4) implies ordinal or categorical relationships
### Interpretation
This diagram likely represents:
1. A categorical distribution of four entities across three groups
2. The bottom circle may represent a superset containing two sub-entities (2 and 3)
3. Top circles could represent distinct categories (1 and 4) separate from the bottom group
4. The absence of overlapping circles suggests mutually exclusive groupings
5. The numerical labels might indicate:
- Entity identifiers
- Priority rankings
- Count values within each group
The diagram's simplicity implies it could represent:
- A basic organizational structure
- A workflow distribution
- A resource allocation model
- A categorical taxonomy
No explicit trends or numerical data relationships are shown beyond the categorical distribution. The spatial arrangement emphasizes the separation between top groups and the bottom group's dual composition.