## Line Chart: Q*_w* and q*_2* vs. Alpha
### Overview
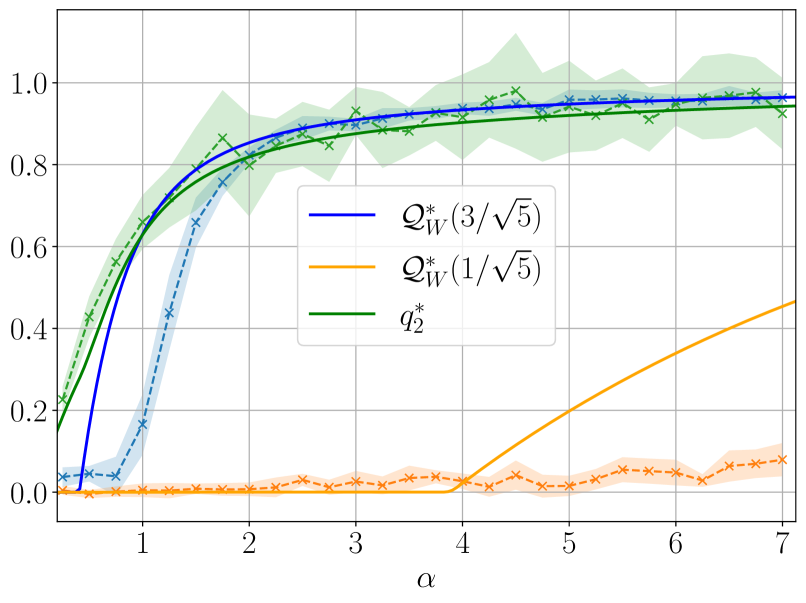
The image is a line chart comparing the behavior of three different quantities, Q*_w*(3/√5), Q*_w*(1/√5), and q*_2* as a function of α. The chart includes error bands around the data points, represented by shaded regions.
### Components/Axes
* **X-axis (Horizontal):** α, ranging from 0 to 7, with tick marks at every integer value.
* **Y-axis (Vertical):** Values ranging from 0.0 to 1.0, with tick marks at intervals of 0.2.
* **Legend (Top-Right):**
* Blue line: Q*_w*(3/√5)
* Orange line: Q*_w*(1/√5)
* Green line: q*_2*
* **Grid:** Present in the background for easier reading of values.
### Detailed Analysis
* **Q*_w*(3/√5) (Blue):**
* Trend: The blue line starts near 0 at α=0, increases rapidly until approximately α=2, and then plateaus around 0.95 for α > 2.
* Data Points:
* α = 0: ~0.03
* α = 1: ~0.45
* α = 2: ~0.85
* α = 3: ~0.92
* α = 4: ~0.94
* α = 5: ~0.95
* α = 6: ~0.96
* α = 7: ~0.96
* Error Band: A light blue dashed line with 'x' markers indicates the error band. The error band is narrow, suggesting low variance.
* **Q*_w*(1/√5) (Orange):**
* Trend: The orange line remains close to 0 until approximately α=4, then increases steadily.
* Data Points:
* α = 0 to 3.5: ~0.02
* α = 4: ~0.03
* α = 5: ~0.15
* α = 6: ~0.30
* α = 7: ~0.47
* Error Band: A light orange dashed line with 'x' markers indicates the error band. The error band is narrow, suggesting low variance.
* **q*_2* (Green):**
* Trend: The green line starts at approximately 0.2 at α=0, increases rapidly until approximately α=2, and then plateaus around 0.92 for α > 2.
* Data Points:
* α = 0: ~0.22
* α = 1: ~0.55
* α = 2: ~0.82
* α = 3: ~0.90
* α = 4: ~0.92
* α = 5: ~0.93
* α = 6: ~0.94
* α = 7: ~0.95
* Error Band: A light green shaded region indicates the error band. The error band is wider than the other two, suggesting higher variance.
### Key Observations
* Q*_w*(3/√5) and q*_2* exhibit similar behavior, rapidly increasing and then plateauing.
* Q*_w*(1/√5) remains low until α reaches approximately 4, after which it starts to increase.
* The error band for q*_2* is wider than those for Q*_w*(3/√5) and Q*_w*(1/√5).
### Interpretation
The chart illustrates how the quantities Q*_w*(3/√5), Q*_w*(1/√5), and q*_2* change with respect to the parameter α. The rapid increase and plateau of Q*_w*(3/√5) and q*_2* suggest that they quickly reach a stable state as α increases. In contrast, Q*_w*(1/√5) shows a delayed response, indicating that it requires a higher value of α to start increasing. The wider error band for q*_2* suggests that it is more sensitive to variations or noise in the system compared to the other two quantities. The data suggests that the parameter α has a significant impact on these quantities, with different thresholds for each.