## Line Chart: Performance vs. Parameter α (with Error Bands)
### Overview
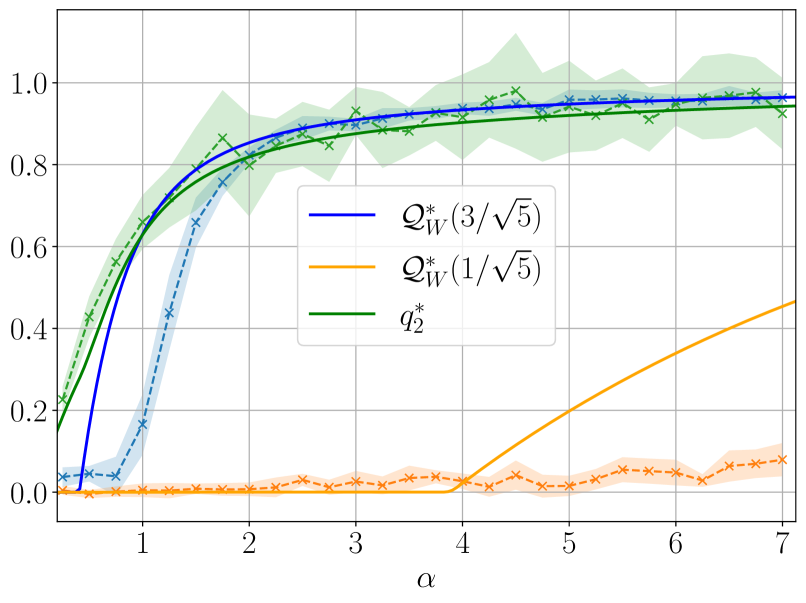
The image is a line chart plotting a performance metric (y-axis, range 0.0–1.0) against a parameter \( \alpha \) (x-axis, range 0–7). Three data series are displayed, each with a solid line, shaded error/confidence band, and cross markers (×) for data points. The legend identifies the series: blue (\( \mathcal{Q}_W^*(3/\sqrt{5}) \)), orange (\( \mathcal{Q}_W^*(1/\sqrt{5}) \)), and green (\( q_2^* \)).
### Components/Axes
- **X-axis (α)**: Labeled "α", with ticks at 0, 1, 2, 3, 4, 5, 6, 7.
- **Y-axis**: Unlabeled, with ticks at 0.0, 0.2, 0.4, 0.6, 0.8, 1.0 (range 0.0–1.0).
- **Legend**: Positioned in the **center** of the chart, with three entries:
- Blue line: \( \mathcal{Q}_W^*(3/\sqrt{5}) \)
- Orange line: \( \mathcal{Q}_W^*(1/\sqrt{5}) \)
- Green line: \( q_2^* \)
- **Data Series**: Each series includes a solid line (mean trend), shaded region (error/confidence band), and cross markers (×) at discrete \( \alpha \) values.
### Detailed Analysis
#### 1. Blue Series (\( \mathcal{Q}_W^*(3/\sqrt{5}) \))
- **Trend**: Starts near 0 at \( \alpha=0 \), rises steeply until \( \alpha \approx 2 \), then plateaus near 1.0 (with minor fluctuations) from \( \alpha \approx 2 \) to 7.
- **Data Points (crosses)**:
- \( \alpha=0 \): ~0.0
- \( \alpha=1 \): ~0.15
- \( \alpha=2 \): ~0.85
- \( \alpha=3 \): ~0.9
- \( \alpha=4 \): ~0.95
- \( \alpha=5 \): ~0.95
- \( \alpha=6 \): ~0.95
- \( \alpha=7 \): ~0.95
- **Error Band**: Narrow (low variance), especially after \( \alpha \approx 2 \).
#### 2. Orange Series (\( \mathcal{Q}_W^*(1/\sqrt{5}) \))
- **Trend**: Remains near 0 until \( \alpha \approx 4 \), then rises gradually, reaching ~0.45 at \( \alpha=7 \).
- **Data Points (crosses)**:
- \( \alpha=0 \): ~0.0
- \( \alpha=1 \): ~0.0
- \( \alpha=2 \): ~0.0
- \( \alpha=3 \): ~0.0
- \( \alpha=4 \): ~0.05
- \( \alpha=5 \): ~0.1
- \( \alpha=6 \): ~0.1
- \( \alpha=7 \): ~0.1 (note: the solid line rises to ~0.45, but data points remain low, indicating high variance).
- **Error Band**: Wide (high variance), especially after \( \alpha \approx 4 \).
#### 3. Green Series (\( q_2^* \))
- **Trend**: Starts at ~0.15 at \( \alpha=0 \), rises steeply until \( \alpha \approx 2 \), then plateaus near 1.0 (similar to blue but slightly lower initially).
- **Data Points (crosses)**:
- \( \alpha=0 \): ~0.15
- \( \alpha=1 \): ~0.6
- \( \alpha=2 \): ~0.8
- \( \alpha=3 \): ~0.9
- \( \alpha=4 \): ~0.95
- \( \alpha=5 \): ~0.95
- \( \alpha=6 \): ~0.95
- \( \alpha=7 \): ~0.95
- **Error Band**: Wider than blue (more variance), especially at low \( \alpha \) (0–2).
### Key Observations
- **Blue vs. Green**: Both rise rapidly with \( \alpha \), reaching near-optimal performance (y≈1.0) by \( \alpha \approx 2–3 \). Blue starts lower than green at \( \alpha=0 \) but catches up by \( \alpha \approx 2 \).
- **Orange**: Remains near 0 until \( \alpha \approx 4 \), then increases slowly (never reaching 1.0). Its error band is the widest, indicating high variability.
- **Error Bands**: Blue has the narrowest band (least variance), green has a wider band (more variance), and orange has the widest band (most variance) after \( \alpha \approx 4 \).
### Interpretation
- **Parameter Sensitivity**: \( \alpha \) strongly influences performance. For \( \mathcal{Q}_W^*(3/\sqrt{5}) \) (blue) and \( q_2^* \) (green), \( \alpha \geq 2 \) yields near-optimal results. For \( \mathcal{Q}_W^*(1/\sqrt{5}) \) (orange), performance is low until \( \alpha \geq 4 \) and remains suboptimal.
- **Model Relationships**: Blue and green have similar trends, suggesting they may be related (e.g., different parameterizations of the same model). Orange is distinct, with a delayed, weaker response to \( \alpha \).
- **Practical Implications**: If \( \alpha \) is a tuning parameter, prioritize \( \alpha \geq 2 \) for blue/green models. Orange requires \( \alpha \geq 4 \) and still underperforms, making it less favorable for high-performance tasks.
This description captures all visible elements, trends, and relationships, enabling reconstruction of the chart’s information without the image.