## Line Graph: Behavior of Q_W* and q₂* Functions vs. α
### Overview
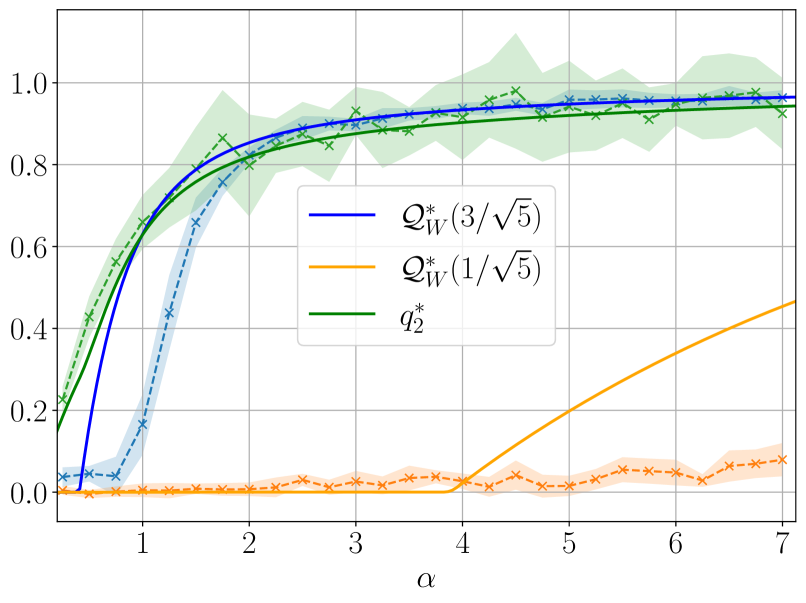
The graph illustrates the relationship between three mathematical functions—Q_W*(3/√5), Q_W*(1/√5), and q₂*—and the variable α (ranging from 1 to 7). The y-axis represents a normalized value between 0 and 1. Key trends include rapid convergence of Q_W*(3/√5) and q₂* at intermediate α values, while Q_W*(1/√5) exhibits a delayed increase. Uncertainty bands (shaded regions) accompany Q_W*(3/√5) and q₂*, suggesting variability in their measurements or models.
### Components/Axes
- **X-axis (α)**: Labeled as α, spanning 1 to 7 in integer increments.
- **Y-axis**: Unitless value from 0 to 1, with increments of 0.2.
- **Legend**: Located in the top-right corner, associating:
- **Blue solid line**: Q_W*(3/√5)
- **Orange dashed line**: Q_W*(1/√5)
- **Green dash-dot line**: q₂*
- **Shaded Regions**:
- Light blue around Q_W*(3/√5)
- Light orange around Q_W*(1/√5)
- Light green around q₂*
### Detailed Analysis
1. **Q_W*(3/√5) (Blue Solid Line)**:
- Starts at ~0.0 when α=1.
- Rises sharply to ~0.9 by α=2.
- Plateaus near 0.95 for α ≥ 3.
- Uncertainty band widest at α=1–2, narrowing afterward.
2. **Q_W*(1/√5) (Orange Dashed Line)**:
- Remains near 0 for α ≤ 4.
- Gradually increases to ~0.5 by α=7.
- Uncertainty band remains narrow throughout.
3. **q₂* (Green Dash-Dot Line)**:
- Begins at ~0.2 when α=1.
- Peaks at ~0.9 by α=2.
- Declines slightly to ~0.85 by α=7.
- Uncertainty band widest at α=1–2, stabilizing afterward.
### Key Observations
- **Convergence**: Q_W*(3/√5) and q₂* overlap closely for α ≥ 3, suggesting similar asymptotic behavior.
- **Delayed Response**: Q_W*(1/√5) lags significantly, remaining near 0 until α=4.
- **Uncertainty**: Higher variability in Q_W*(3/√5) and q₂* at low α values, diminishing as α increases.
- **Data Markers**: Crosses (×) denote data points for Q_W*(1/√5), while circles (○) mark Q_W*(3/√5) and q₂*.
### Interpretation
The graph likely compares the performance of two weighted functions (Q_W* with different scaling factors) and a secondary metric (q₂*). The rapid rise of Q_W*(3/√5) and q₂* implies they stabilize quickly with increasing α, while Q_W*(1/√5) requires larger α to show meaningful growth. The uncertainty bands highlight confidence intervals, with Q_W*(3/√5) and q₂* showing greater variability at low α. The convergence of Q_W*(3/√5) and q₂* at higher α suggests they may represent complementary or equivalent mechanisms under certain conditions. The delayed response of Q_W*(1/√5) could indicate a threshold effect or dependency on additional parameters not captured in this model.