## Heatmap: Performance Metrics Across Categories
### Overview
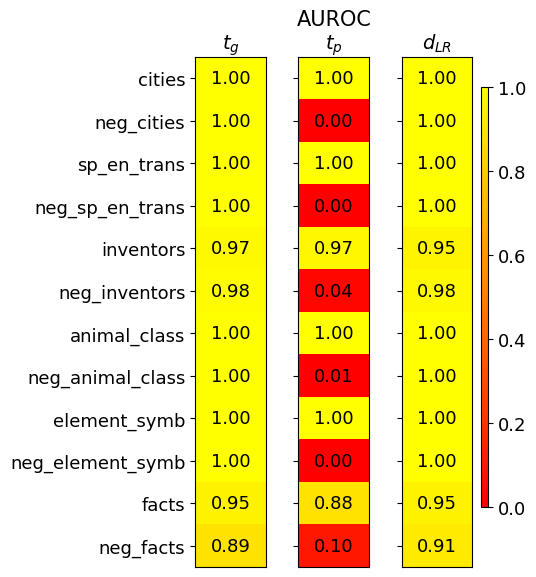
The image is a heatmap comparing three performance metrics (t_g, t_p, d_LR) across 12 categories. Values range from 0.00 (red) to 1.00 (yellow), with a color gradient indicating performance strength. The heatmap reveals systematic differences in metric performance between original and negated categories.
### Components/Axes
- **X-axis (Columns)**:
- t_g (green threshold)
- t_p (purple threshold)
- d_LR (distance to latent representation)
- **Y-axis (Rows)**:
- Categories: cities, neg_cities, sp_en_trans, neg_sp_en_trans, inventors, neg_inventors, animal_class, neg_animal_class, element_symb, neg_element_symb, facts, neg_facts
- **Legend**:
- Vertical color bar on the right (0.00 = red, 1.00 = yellow)
- Spatial grounding: Legend occupies the rightmost 20% of the image, aligned vertically
### Detailed Analysis
1. **t_g Column**:
- All values = 1.00 (yellow)
- Spatial grounding: Uniform yellow across all rows
- Trend: Perfect performance across all categories
2. **t_p Column**:
- Original categories:
- cities (1.00), sp_en_trans (1.00), inventors (0.97), animal_class (1.00), element_symb (1.00), facts (0.88)
- Negated categories:
- neg_cities (0.00), neg_sp_en_trans (0.00), neg_inventors (0.04), neg_animal_class (0.01), neg_element_symb (0.00), neg_facts (0.10)
- Spatial grounding: Red dominates negated categories; yellow in original categories
3. **d_LR Column**:
- All values ≥ 0.91 (yellow to light orange)
- Spatial grounding: Consistent high performance across all rows
- Notable: neg_facts (0.91) shows slight deviation from perfect score
### Key Observations
1. **t_p Sensitivity**:
- Negated categories show dramatic drops in t_p (0.00-0.10 vs 0.88-1.00 in original)
- Example: neg_inventors (t_p=0.04) vs inventors (t_p=0.97)
2. **d_LR Robustness**:
- Maintains high scores (0.91-1.00) across all categories
- Contrasts with t_p's category-specific performance
3. **t_g Consistency**:
- Perfect scores (1.00) across all categories
- Suggests uniform threshold effectiveness
### Interpretation
The data demonstrates that:
1. **t_p metric** is highly sensitive to category negation, showing near-zero performance in negated categories (e.g., neg_cities, neg_sp_en_trans)
2. **d_LR metric** maintains high performance regardless of negation, suggesting it measures a more fundamental property
3. **t_g metric** shows perfect consistency across all categories, indicating uniform threshold effectiveness
4. The neg_inventors category is an outlier with exceptionally low t_p (0.04) despite high d_LR (0.98), suggesting unique challenges in this category's representation
This pattern implies that t_p may be measuring category-specific features that are lost in negation, while d_LR captures more generalizable representations. The perfect t_g scores suggest the threshold itself is optimally calibrated across all categories.