## Heatmap: AUROC Performance Comparison
### Overview
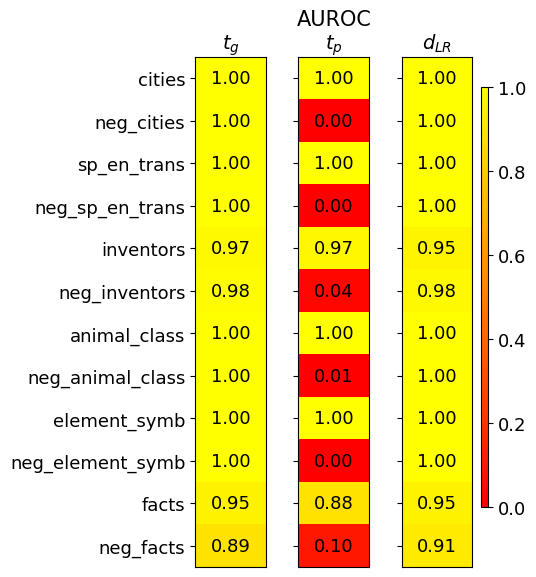
The image is a heatmap displaying AUROC (Area Under the Receiver Operating Characteristic curve) values for different categories across three different models or conditions, labeled as *t_g*, *t_p*, and *d_LR*. The heatmap uses a color gradient from red (low AUROC) to yellow (high AUROC) to represent the performance of each category.
### Components/Axes
* **Title:** AUROC
* **Columns (Models/Conditions):**
* *t_g* (top)
* *t_p* (top)
* *d_LR* (top)
* **Rows (Categories):**
* cities
* neg\_cities
* sp\_en\_trans
* neg\_sp\_en\_trans
* inventors
* neg\_inventors
* animal\_class
* neg\_animal\_class
* element\_symb
* neg\_element\_symb
* facts
* neg\_facts
* **Colorbar (AUROC Scale):** Ranges from 0.0 (red) to 1.0 (yellow).
### Detailed Analysis or Content Details
Here's a breakdown of the AUROC values for each category and model:
* **cities:**
* *t_g*: 1.00 (yellow)
* *t_p*: 1.00 (yellow)
* *d_LR*: 1.00 (yellow)
* **neg\_cities:**
* *t_g*: 1.00 (yellow)
* *t_p*: 0.00 (red)
* *d_LR*: 1.00 (yellow)
* **sp\_en\_trans:**
* *t_g*: 1.00 (yellow)
* *t_p*: 1.00 (yellow)
* *d_LR*: 1.00 (yellow)
* **neg\_sp\_en\_trans:**
* *t_g*: 1.00 (yellow)
* *t_p*: 0.00 (red)
* *d_LR*: 1.00 (yellow)
* **inventors:**
* *t_g*: 0.97 (yellow)
* *t_p*: 0.97 (yellow)
* *d_LR*: 0.95 (yellow)
* **neg\_inventors:**
* *t_g*: 0.98 (yellow)
* *t_p*: 0.04 (red)
* *d_LR*: 0.98 (yellow)
* **animal\_class:**
* *t_g*: 1.00 (yellow)
* *t_p*: 1.00 (yellow)
* *d_LR*: 1.00 (yellow)
* **neg\_animal\_class:**
* *t_g*: 1.00 (yellow)
* *t_p*: 0.01 (red)
* *d_LR*: 1.00 (yellow)
* **element\_symb:**
* *t_g*: 1.00 (yellow)
* *t_p*: 1.00 (yellow)
* *d_LR*: 1.00 (yellow)
* **neg\_element\_symb:**
* *t_g*: 1.00 (yellow)
* *t_p*: 0.00 (red)
* *d_LR*: 1.00 (yellow)
* **facts:**
* *t_g*: 0.95 (yellow)
* *t_p*: 0.88 (yellow)
* *d_LR*: 0.95 (yellow)
* **neg\_facts:**
* *t_g*: 0.89 (yellow)
* *t_p*: 0.10 (red)
* *d_LR*: 0.91 (yellow)
### Key Observations
* *t_g* and *d_LR* consistently show high AUROC values (close to 1.00) across all categories.
* *t_p* shows significantly lower AUROC values (close to 0.00) for the "neg\_" prefixed categories (neg\_cities, neg\_sp\_en\_trans, neg\_inventors, neg\_animal\_class, neg\_element\_symb, neg\_facts).
* The "neg\_" prefixed categories generally represent negative examples or counterfactuals of the corresponding positive categories.
### Interpretation
The heatmap suggests that models *t_g* and *d_LR* perform well in distinguishing between positive and negative examples across all categories. However, model *t_p* struggles significantly with the "neg\_" prefixed categories, indicating a potential issue in handling negative examples or counterfactuals. This could be due to the model being biased towards positive examples or having difficulty in understanding the relationships between positive and negative counterparts. The high AUROC values for *t_g* and *d_LR* indicate strong performance in these tasks, while the near-zero values for *t_p* on negative examples suggest a failure to correctly classify these instances.
```