## Line Chart: Max and Min Values Across Layer Indices
### Overview
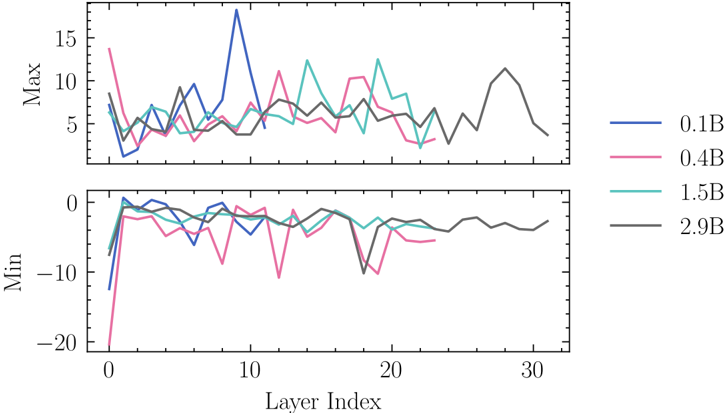
The image contains two stacked line charts (top: "Max", bottom: "Min") showing the variation of maximum and minimum values across 31 layer indices (0–30). Four data series are represented by distinct colors (blue, pink, cyan, black), each corresponding to a specific "B" value (0.1B, 0.4B, 1.5B, 2.9B). The charts exhibit oscillatory patterns with peaks and troughs, suggesting dynamic relationships between layer indices and the measured values.
### Components/Axes
- **X-axis (Layer Index)**: Ranges from 0 to 30 in integer increments.
- **Y-axis (Top Chart - Max)**: Ranges from -20 to 15, labeled "Max".
- **Y-axis (Bottom Chart - Min)**: Ranges from -20 to 0, labeled "Min".
- **Legend**: Positioned on the right, with four entries:
- Blue: 0.1B
- Pink: 0.4B
- Cyan: 1.5B
- Black: 2.9B
### Detailed Analysis
#### Max Values (Top Chart)
- **0.1B (Blue)**: Peaks sharply at layer 5 (~12), then declines with minor fluctuations. Ends near 5 at layer 30.
- **0.4B (Pink)**: Peaks at layer 10 (~10), followed by a gradual decline. Ends near 3 at layer 30.
- **1.5B (Cyan)**: Peaks at layer 15 (~8), then stabilizes. Ends near 4 at layer 30.
- **2.9B (Black)**: Peaks at layer 20 (~14), then declines. Ends near 6 at layer 30.
#### Min Values (Bottom Chart)
- **0.1B (Blue)**: Dips below -10 at layer 5, recovers to -2 by layer 30.
- **0.4B (Pink)**: Dips to -12 at layer 10, recovers to -3 by layer 30.
- **1.5B (Cyan)**: Dips to -10 at layer 15, recovers to -1 by layer 30.
- **2.9B (Black)**: Dips to -8 at layer 20, recovers to 0 by layer 30.
### Key Observations
1. **Peak Alignment**: Each B value's maximum and minimum values align spatially across both charts (e.g., 0.1B peaks at layer 5 in Max and dips at layer 5 in Min).
2. **Inverse Relationship**: Higher B values (e.g., 2.9B) exhibit later-layer peaks in Max and later-layer troughs in Min compared to lower B values.
3. **Amplitude Trends**: Larger B values (1.5B, 2.9B) show smaller amplitude oscillations in both Max and Min compared to smaller B values (0.1B, 0.4B).
4. **Recovery Patterns**: All series recover toward baseline values (0 for Min, ~5 for Max) by layer 30, suggesting stabilization at higher indices.
### Interpretation
The data suggests that the parameter "B" modulates the layer-specific behavior of maximum and minimum values. Larger B values delay the occurrence of extreme values (peaks/troughs) to higher layer indices, while smaller B values exhibit earlier extremes. The consistent recovery toward baseline values by layer 30 implies a convergence or stabilization effect at later layers, independent of B magnitude. The inverse relationship between B and the timing of extremes may indicate a scaling effect in the underlying system, where larger B values require deeper layers to manifest their influence. The oscillatory nature of the curves could reflect iterative processes or feedback mechanisms within the modeled system.