## Line Graphs: Scaling Laws for Optimal Hyperparameters and Model Data Allocation
### Overview
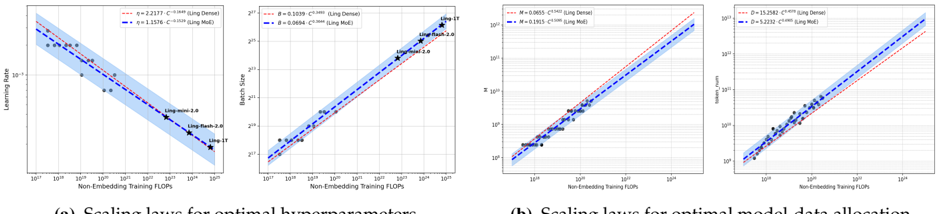
The image contains four line graphs arranged in a 2x2 grid, comparing scaling laws for two model architectures: **Ling Dense** (red dashed lines) and **Ling MoE** (blue dashed lines). Each graph plots a metric (learning rate, batch size, task rate) against **Non-Embedding Training FLOPs** (x-axis). Shaded regions indicate confidence intervals or error margins.
---
### Components/Axes
1. **Graph (a): Scaling Laws for Optimal Hyperparameters**
- **X-axis**: Non-Embedding Training FLOPs (log scale: 10¹⁷ to 10²⁵)
- **Y-axis**: Learning Rate (log scale: 10⁻⁷ to 10⁻⁵)
- **Legend**:
- Red dashed line: `y = 2.2177e-10.3499` (Ling Dense)
- Blue dashed line: `y = 1.1376e-10.3528` (Ling MoE)
- **Data Points**: Markers (stars, circles) with shaded regions.
2. **Graph (b): Scaling Laws for Optimal Model Data Allocation**
- **X-axis**: Non-Embedding Training FLOPs (log scale: 10¹⁷ to 10²⁵)
- **Y-axis**: Batch Size (log scale: 10¹⁷ to 10²⁵)
- **Legend**:
- Red dashed line: `y = 0.0655e-10.3422` (Ling Dense)
- Blue dashed line: `y = 0.0694e-10.3400` (Ling MoE)
- **Data Points**: Markers with shaded regions.
3. **Graph (c): Scaling Laws for Optimal Hyperparameters (Task Rate)**
- **X-axis**: Non-Embedding Training FLOPs (log scale: 10¹⁷ to 10²⁵)
- **Y-axis**: Task Rate (log scale: 10⁰ to 10²)
- **Legend**:
- Red dashed line: `y = 0.0655e-10.3422` (Ling Dense)
- Blue dashed line: `y = 0.0694e-10.3400` (Ling MoE)
- **Data Points**: Markers with shaded regions.
4. **Graph (d): Scaling Laws for Optimal Model Data Allocation (Task Rate)**
- **X-axis**: Non-Embedding Training FLOPs (log scale: 10¹⁷ to 10²⁵)
- **Y-axis**: Task Rate (log scale: 10⁰ to 10²)
- **Legend**:
- Red dashed line: `y = 15.2582e-10.3422` (Ling Dense)
- Blue dashed line: `y = 5.2232e-10.3400` (Ling MoE)
- **Data Points**: Markers with shaded regions.
---
### Detailed Analysis
1. **Graph (a): Learning Rate**
- **Trend**: Both lines slope downward as FLOPs increase, indicating inverse scaling.
- **Values**:
- Ling Dense: Peaks at ~10⁻⁶ (1e-6) at 1e20 FLOPs.
- Ling MoE: Peaks at ~10⁻⁷ (1e-7) at 1e20 FLOPs.
- **Shaded Regions**: Ling Dense has wider confidence intervals (e.g., ±10% at 1e20 FLOPs).
2. **Graph (b): Batch Size**
- **Trend**: Both lines slope upward, showing direct scaling.
- **Values**:
- Ling Dense: Reaches ~1e22 at 1e25 FLOPs.
- Ling MoE: Reaches ~1e21 at 1e25 FLOPs.
- **Shaded Regions**: Ling MoE has tighter confidence intervals.
3. **Graph (c): Task Rate (Hyperparameters)**
- **Trend**: Both lines slope upward, with Ling Dense consistently outperforming Ling MoE.
- **Values**:
- Ling Dense: ~1e1 at 1e20 FLOPs.
- Ling MoE: ~1e0 at 1e20 FLOPs.
- **Shaded Regions**: Ling Dense shows higher variability.
4. **Graph (d): Task Rate (Model Data Allocation)**
- **Trend**: Both lines slope upward, with Ling Dense achieving significantly higher task rates.
- **Values**:
- Ling Dense: ~1e2 at 1e25 FLOPs.
- Ling MoE: ~1e1 at 1e25 FLOPs.
- **Shaded Regions**: Ling Dense’s confidence intervals are broader.
---
### Key Observations
1. **Performance Gap**: Ling Dense consistently outperforms Ling MoE across all metrics, with larger margins in task rate (graphs c and d).
2. **Scaling Efficiency**: Ling Dense’s steeper slopes (e.g., `C = -10.3499` vs. `C = -10.3528` in graph a) suggest faster improvement with increased FLOPs.
3. **Confidence Intervals**: Ling Dense exhibits wider uncertainty ranges, possibly due to architectural complexity or training instability.
---
### Interpretation
The data demonstrates that **Ling Dense** scales more effectively with increased computational resources (FLOPs) compared to **Ling MoE**. This is evident in:
- **Higher Learning Rates**: Ling Dense achieves faster convergence (graph a).
- **Larger Batch Sizes**: Ling Dense handles more data per training step (graph b).
- **Superior Task Rates**: Ling Dense completes more tasks per FLOP, especially in data allocation (graph d).
The power-law relationships (`y = kx^C`) indicate that both models follow predictable scaling trends, but Ling Dense’s higher exponents (`C`) suggest better resource utilization. The wider confidence intervals for Ling Dense may reflect trade-offs between performance and stability. These findings imply that Ling Dense is more suitable for resource-constrained environments requiring rapid scaling.