\n
## Diagram: Network Connection Illustration
### Overview
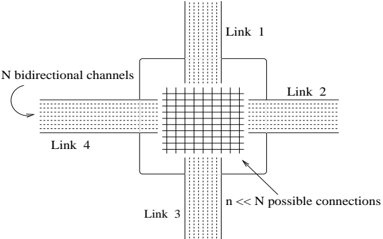
The image is a schematic diagram illustrating a network connection point with multiple bidirectional channels and possible connections. It depicts four links (Link 1, Link 2, Link 3, Link 4) converging at a central grid-like structure representing potential connections. The diagram highlights the difference between the total number of bidirectional channels (N) and the actual number of possible connections (n), where n is significantly smaller than N.
### Components/Axes
The diagram consists of the following labeled components:
* **Link 1:** A vertical line extending upwards from the central grid.
* **Link 2:** A horizontal line extending to the right from the central grid.
* **Link 3:** A vertical line extending downwards from the central grid.
* **Link 4:** A horizontal line extending to the left from the central grid.
* **N bidirectional channels:** An arc pointing to a series of horizontal lines extending from Link 4.
* **n << N possible connections:** An arrow pointing to the grid structure within the central connection point.
### Detailed Analysis or Content Details
The diagram shows a central square grid formed by intersecting lines. This grid represents the potential connections between the four links. The number of possible connections (n) is stated to be much smaller than the total number of bidirectional channels (N). The lines representing the N bidirectional channels are shown extending from Link 4. The grid appears to have approximately 10 rows and 10 columns, suggesting around 100 possible connection points within the grid. However, only a small subset of these points are actually utilized, as indicated by the "n << N" label.
### Key Observations
The key observation is the disparity between the potential connections (N) and the actual connections (n). This suggests a sparse connectivity pattern, where only a limited number of channels are actively used despite a large number of available channels. The diagram emphasizes the concept of resource utilization or bandwidth allocation in a network.
### Interpretation
The diagram likely represents a network switch or router with multiple input/output links. The "N bidirectional channels" represent the total capacity of the network, while "n << N possible connections" indicates that the actual traffic flow is significantly lower than the maximum capacity. This could be due to various factors, such as low network demand, traffic prioritization, or limitations in the network infrastructure. The diagram highlights the importance of efficient resource management in network design. The grid structure could represent a crossbar switch architecture, where each input link can be connected to any output link. However, the sparse connectivity suggests that not all possible connections are utilized, potentially to reduce complexity or cost. The diagram is a conceptual illustration rather than a precise representation of a specific network configuration. It serves to convey the general principle of limited connectivity within a larger network capacity.