## Diagram: Data Processing Flow
### Overview
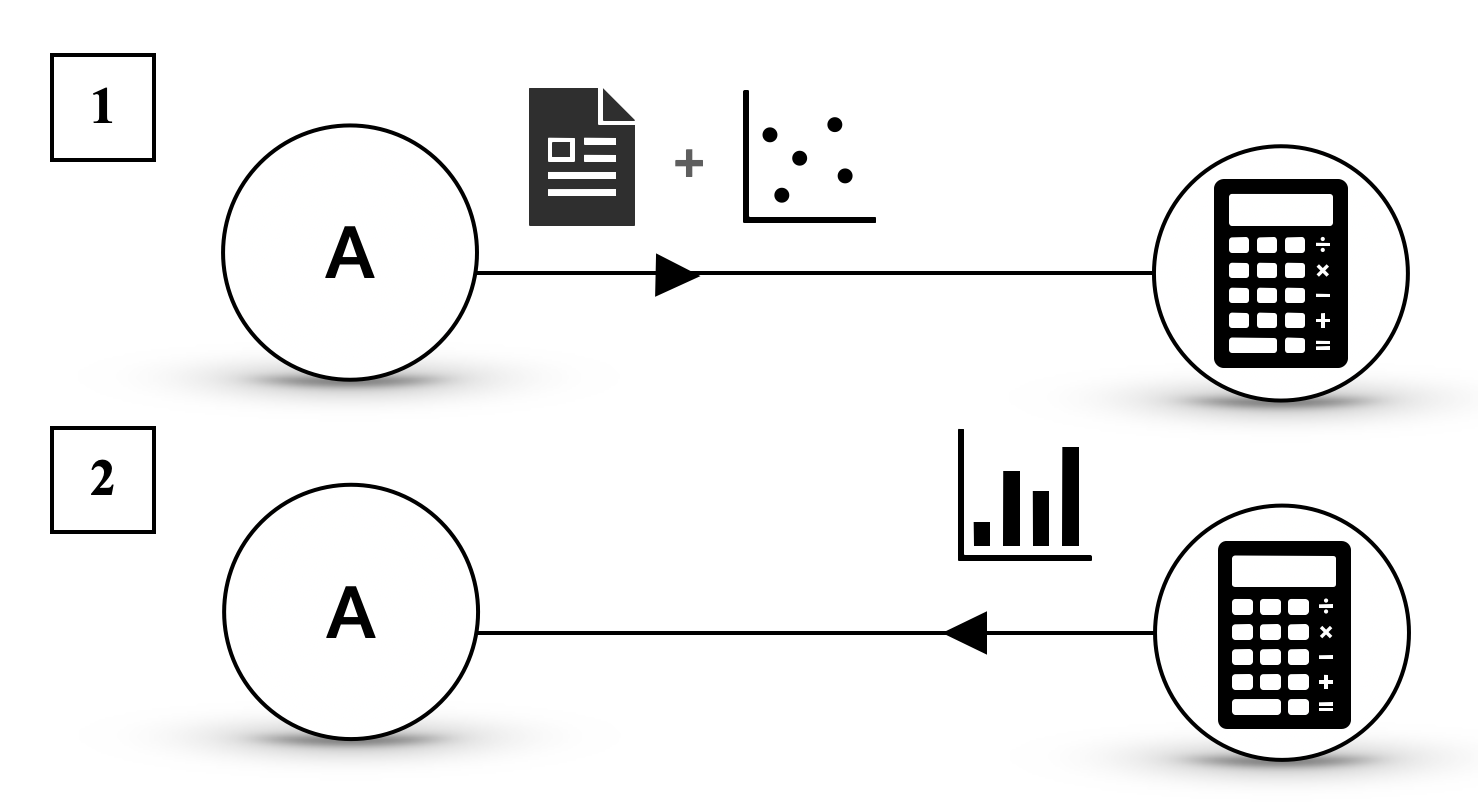
This diagram illustrates two distinct data processing flows, both originating from a component labeled "A". Each flow leads to a calculator icon, suggesting a computational or analytical process. The key difference between the two flows lies in the type of data input preceding the calculator.
### Components/Axes
The diagram consists of the following elements:
* **Numbered Labels:**
* "1" (top-left)
* "2" (bottom-left)
* **Circular Nodes:**
* A circle with the letter "A" inside, present in both flow 1 and flow 2.
* **Iconographic Representations of Data/Processes:**
* **Flow 1:**
* A document icon (representing data or a report).
* A plus sign (+) icon.
* A scatter plot icon (representing data points).
* **Flow 2:**
* A bar chart icon (representing data visualization or aggregated data).
* **Arrows:**
* A black arrow indicating the direction of flow from "A" through the data icons to the calculator.
* A second black arrow indicating the direction of flow from "A" through the data icons to the calculator.
* **Calculator Icons:**
* A stylized icon of a calculator with buttons and a display, present at the end of both flow 1 and flow 2.
### Detailed Analysis or Content Details
**Flow 1 (Labeled "1"):**
1. **Starting Point:** Component "A".
2. **Intermediate Data Representation:** The flow from "A" is followed by a combination of a document icon and a scatter plot icon, linked by a plus sign. This suggests that "A" provides input that is then combined with a document and a scatter plot for further processing.
3. **End Point:** The combined data is processed by a calculator icon.
**Flow 2 (Labeled "2"):**
1. **Starting Point:** Component "A".
2. **Intermediate Data Representation:** The flow from "A" is followed by a bar chart icon. This suggests that "A" provides input that is then processed using bar chart data.
3. **End Point:** The bar chart data is processed by a calculator icon.
### Key Observations
* Both flows originate from the same component "A".
* Both flows culminate in a calculator, implying a computational or analytical outcome.
* The primary distinction is the nature of the data input: Flow 1 uses a combination of a document and a scatter plot, while Flow 2 uses a bar chart.
### Interpretation
This diagram visually represents two different pathways for processing information originating from a source labeled "A".
* **Flow 1** suggests a process where raw data (potentially represented by the document and scatter plot) is fed into a computational tool (the calculator). The scatter plot specifically implies a need for analyzing relationships or distributions between variables.
* **Flow 2** suggests a process where summarized or visualized data (represented by the bar chart) is used for calculation or analysis. Bar charts typically represent comparisons or trends of discrete categories.
The presence of the plus sign in Flow 1 between the document and scatter plot icons could indicate that the document contains the raw data that is then plotted, or that the document and scatter plot are separate but combined inputs.
Overall, the diagram demonstrates that the same initial component "A" can lead to different analytical outcomes depending on the type of data or representation used in the subsequent steps. This could represent different analytical strategies or different types of data outputs derived from "A". The calculator icon at the end of each path signifies that a quantitative or logical operation is performed on the preceding data.