## Diagram: Data Processing Workflow
### Overview
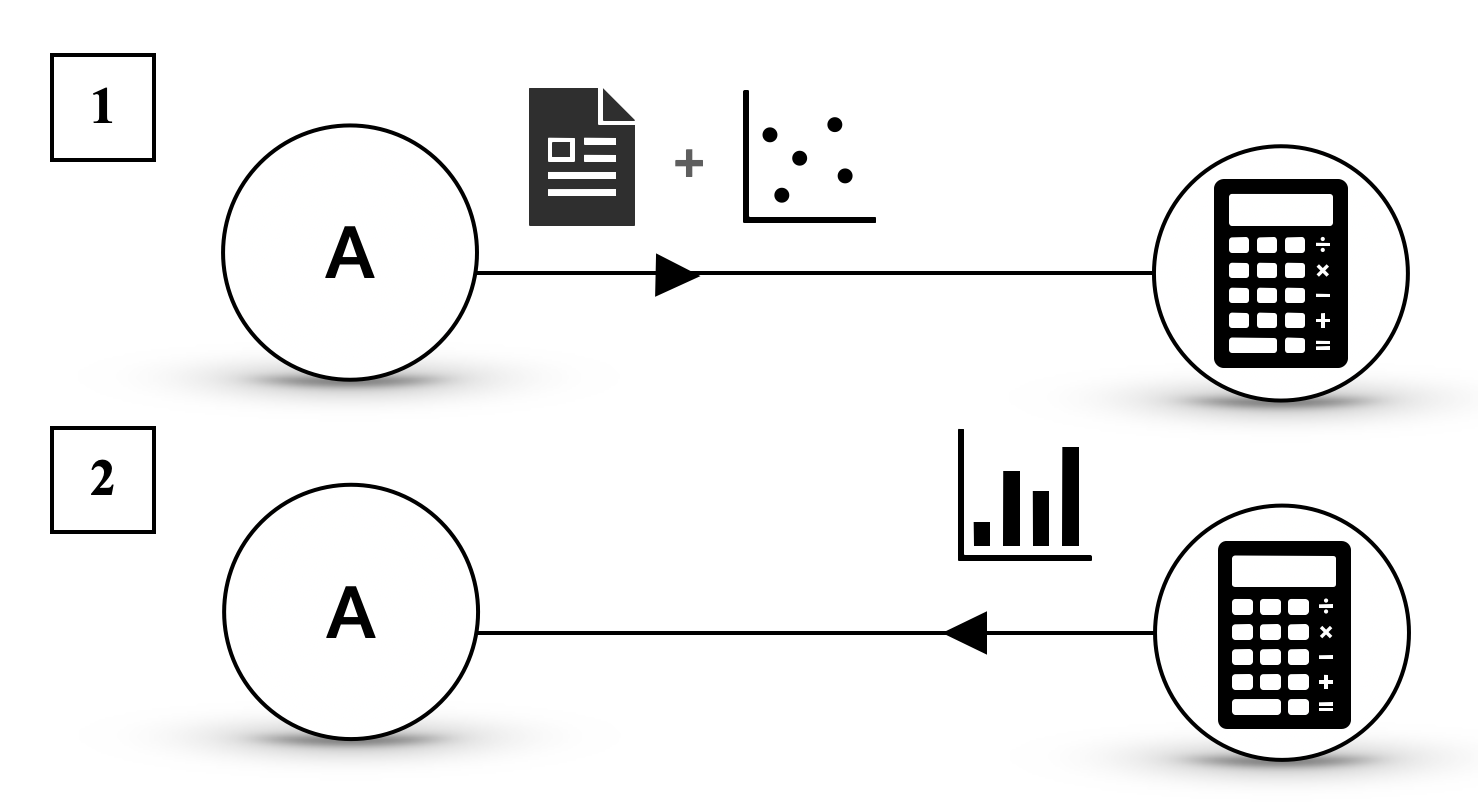
The image depicts two sequential diagrams (labeled "1" and "2") illustrating a data processing workflow. Both diagrams feature a central circle labeled "A" connected via arrows to a calculator icon, with distinct input elements preceding the calculator in each case.
### Components/Axes
1. **Diagram 1 (Top)**:
- **Input Elements**:
- A document icon (text-based data).
- A scatter plot (discrete data points).
- **Process**:
- A bidirectional arrow connects the document icon and scatter plot to circle "A".
- A unidirectional arrow links circle "A" to a calculator icon.
- **Labels**:
- "1" (top-left corner).
- "A" (center of the first circle).
2. **Diagram 2 (Bottom)**:
- **Input Element**:
- A bar chart (aggregated data).
- **Process**:
- A unidirectional arrow connects the bar chart directly to circle "A".
- A unidirectional arrow links circle "A" to the same calculator icon as in Diagram 1.
- **Labels**:
- "2" (bottom-left corner).
- "A" (center of the second circle).
### Detailed Analysis
- **Diagram 1**: Combines raw text data (document) and unstructured numerical data (scatter plot) as inputs to circle "A", which then feeds into the calculator.
- **Diagram 2**: Uses structured numerical data (bar chart) as input to circle "A", which also feeds into the calculator.
- **Calculator Icon**: Appears in both diagrams, suggesting it is the endpoint for computational analysis regardless of input type.
### Key Observations
1. **Consistency in Output**: Both diagrams converge on the calculator, implying it performs a unified computational role (e.g., calculations, analysis).
2. **Input Variability**: Diagram 1 handles unstructured data (text + scatter), while Diagram 2 uses structured data (bar chart), highlighting adaptability in the workflow.
3. **Directionality**: Arrows enforce a strict sequence: inputs → circle "A" → calculator.
### Interpretation
This workflow likely represents a system for processing diverse data types (text, raw numerical, aggregated numerical) through a central processing node ("A") before computational analysis. The calculator’s dual appearance suggests it is the final step for deriving insights or results. The use of "A" as a intermediary node may indicate preprocessing, validation, or transformation of data before computation. The diagrams emphasize flexibility in handling different data formats while maintaining a standardized output process.