## Heatmap: AUROC Scores for Different Categories
### Overview
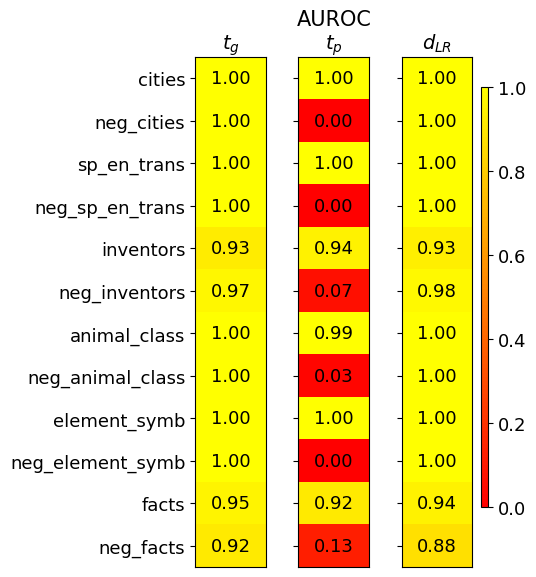
The image is a heatmap displaying AUROC (Area Under the Receiver Operating Characteristic curve) scores for different categories across three different methods or models, labeled as *t_g*, *t_p*, and *d_LR*. The heatmap uses a color gradient from red (low AUROC) to yellow (high AUROC) to represent the scores. The categories are listed on the left side of the heatmap.
### Components/Axes
* **Title:** AUROC
* **Columns:**
* *t_g* (left column)
* *t_p* (middle column)
* *d_LR* (right column)
* **Rows (Categories):**
* cities
* neg\_cities
* sp\_en\_trans
* neg\_sp\_en\_trans
* inventors
* neg\_inventors
* animal\_class
* neg\_animal\_class
* element\_symb
* neg\_element\_symb
* facts
* neg\_facts
* **Color Scale (Legend):** Located on the right side of the heatmap. The scale ranges from 0.0 (red) to 1.0 (yellow).
### Detailed Analysis or Content Details
Here's a breakdown of the AUROC scores for each category and method:
* **cities:**
* *t_g*: 1.00 (yellow)
* *t_p*: 1.00 (yellow)
* *d_LR*: 1.00 (yellow)
* **neg\_cities:**
* *t_g*: 1.00 (yellow)
* *t_p*: 0.00 (red)
* *d_LR*: 1.00 (yellow)
* **sp\_en\_trans:**
* *t_g*: 1.00 (yellow)
* *t_p*: 1.00 (yellow)
* *d_LR*: 1.00 (yellow)
* **neg\_sp\_en\_trans:**
* *t_g*: 1.00 (yellow)
* *t_p*: 0.00 (red)
* *d_LR*: 1.00 (yellow)
* **inventors:**
* *t_g*: 0.93 (yellow)
* *t_p*: 0.94 (yellow)
* *d_LR*: 0.93 (yellow)
* **neg\_inventors:**
* *t_g*: 0.97 (yellow)
* *t_p*: 0.07 (red)
* *d_LR*: 0.98 (yellow)
* **animal\_class:**
* *t_g*: 1.00 (yellow)
* *t_p*: 0.99 (yellow)
* *d_LR*: 1.00 (yellow)
* **neg\_animal\_class:**
* *t_g*: 1.00 (yellow)
* *t_p*: 0.03 (red)
* *d_LR*: 1.00 (yellow)
* **element\_symb:**
* *t_g*: 1.00 (yellow)
* *t_p*: 1.00 (yellow)
* *d_LR*: 1.00 (yellow)
* **neg\_element\_symb:**
* *t_g*: 1.00 (yellow)
* *t_p*: 0.00 (red)
* *d_LR*: 1.00 (yellow)
* **facts:**
* *t_g*: 0.95 (yellow)
* *t_p*: 0.92 (yellow)
* *d_LR*: 0.94 (yellow)
* **neg\_facts:**
* *t_g*: 0.92 (yellow)
* *t_p*: 0.13 (red)
* *d_LR*: 0.88 (yellow)
### Key Observations
* The *t_g* and *d_LR* columns generally show high AUROC scores (mostly yellow), indicating good performance for these methods across most categories.
* The *t_p* column shows significantly lower AUROC scores (red) for the "neg\_" categories (neg\_cities, neg\_sp\_en\_trans, neg\_inventors, neg\_animal\_class, neg\_element\_symb, neg\_facts), indicating poor performance for these categories with this method.
* For positive categories (cities, sp\_en\_trans, inventors, animal\_class, element\_symb, facts), all three methods (*t_g*, *t_p*, and *d_LR*) show high AUROC scores.
### Interpretation
The heatmap suggests that the *t_g* and *d_LR* methods perform well across all categories, while the *t_p* method struggles with the "neg\_" categories. This could indicate that the *t_p* method is not effective at distinguishing between negative examples in these categories. The high AUROC scores for the positive categories across all methods suggest that all three methods are good at identifying positive examples. The "neg\_" prefix likely indicates negative sampling or a similar technique, and the poor performance of *t_p* on these categories warrants further investigation. It is possible that *t_p* is overfitting to the positive examples or is not properly handling the negative examples in these specific categories.