## Heatmap: AUROC Metrics Across Categories
### Overview
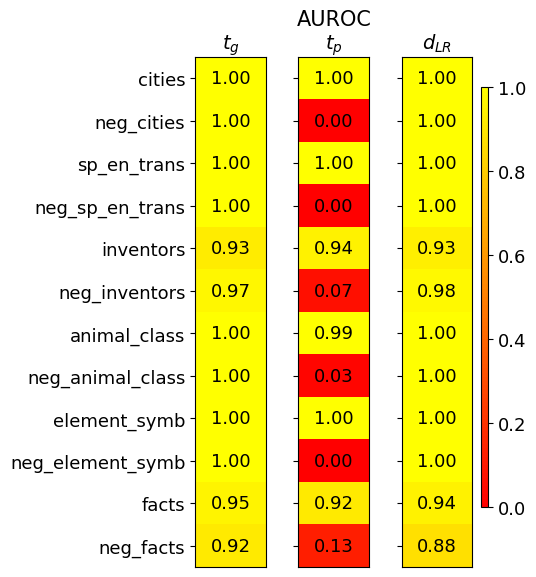
The image is a heatmap comparing three performance metrics (t_g, t_p, d_LR) across 12 categories. Values range from 0.00 to 1.00, with a color gradient from red (low) to yellow (high). The legend on the right maps colors to numerical values.
### Components/Axes
- **Columns**:
- `t_g` (leftmost column)
- `t_p` (middle column)
- `d_LR` (rightmost column)
- **Rows**: Categories (e.g., cities, neg_cities, sp_en_trans, etc.)
- **Legend**: Vertical color bar labeled "AUROC" with values from 0.0 (red) to 1.0 (yellow).
### Detailed Analysis
| Category | t_g | t_p | d_LR | Color Notes |
|------------------------|-------|-------|-------|--------------------------------------|
| cities | 1.00 | 1.00 | 1.00 | Yellow (highest value) |
| neg_cities | 1.00 | 0.00 | 1.00 | Red (lowest value) |
| sp_en_trans | 1.00 | 1.00 | 1.00 | Yellow |
| neg_sp_en_trans | 1.00 | 0.00 | 1.00 | Red |
| inventors | 0.93 | 0.94 | 0.93 | Light yellow |
| neg_inventors | 0.97 | 0.07 | 0.98 | Red (t_p) |
| animal_class | 1.00 | 0.99 | 1.00 | Yellow |
| neg_animal_class | 1.00 | 0.03 | 1.00 | Red (t_p) |
| element_symb | 1.00 | 1.00 | 1.00 | Yellow |
| neg_element_symb | 1.00 | 0.00 | 1.00 | Red |
| facts | 0.95 | 0.92 | 0.94 | Light yellow |
| neg_facts | 0.92 | 0.13 | 0.88 | Red (t_p) |
### Key Observations
1. **High Performance**: Most categories achieve near-perfect scores (1.00) in `t_g` and `d_LR`, with `t_p` also high except for negated categories.
2. **Negated Categories**: All "neg_" prefixed rows show drastically lower `t_p` values (e.g., neg_cities: 0.00, neg_inventors: 0.07), suggesting poor performance in this metric.
3. **Consistency in d_LR**: The `d_LR` metric remains consistently high (>0.88) across all categories, indicating robustness in this measure.
4. **Outliers**:
- `neg_facts` has the lowest `d_LR` (0.88), slightly below others.
- `neg_animal_class` has the lowest `t_p` (0.03).
### Interpretation
- **t_p Discrepancy**: The `t_p` metric shows significant drops for negated categories, implying potential issues in handling negated terms or false positives in these cases.
- **Robustness of d_LR**: The high `d_LR` values suggest the model maintains strong discriminative ability across all categories, even when `t_p` falters.
- **Negation Impact**: The consistent underperformance of negated categories in `t_p` highlights a possible weakness in the model's ability to handle negated semantics, warranting further investigation into feature engineering or model architecture for such cases.