## Line Chart: Average Response Length
### Overview
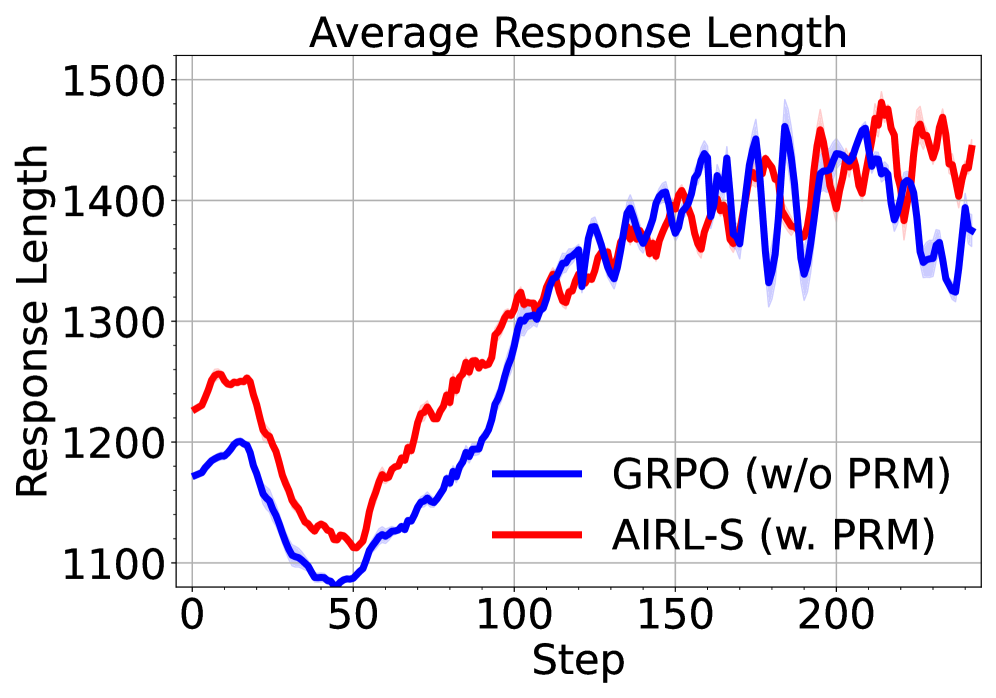
The chart compares the average response length of two methods, **GRPO (w/o PRM)** and **AIRL-S (w. PRM)**, across 200 steps. Both lines exhibit fluctuating trends, with AIRL-S (red) generally maintaining higher response lengths than GRPO (blue) after step 100. The blue line shows a pronounced dip around step 50, while the red line remains relatively stable until divergence post-step 100.
### Components/Axes
- **X-axis (Step)**: Ranges from 0 to 200 in increments of 50.
- **Y-axis (Response Length)**: Ranges from 1100 to 1500 in increments of 100.
- **Legend**: Located at the bottom-right corner.
- **Blue line**: GRPO (w/o PRM)
- **Red line**: AIRL-S (w. PRM)
- **Grid**: Light gray gridlines for reference.
### Detailed Analysis
1. **Initial Phase (Steps 0–50)**:
- **GRPO (blue)**: Starts at ~1180, dips sharply to ~1100 by step 50.
- **AIRL-S (red)**: Starts at ~1230, declines gradually to ~1120 by step 50.
- **Observation**: GRPO exhibits a steeper decline than AIRL-S in this phase.
2. **Mid-Phase (Steps 50–100)**:
- Both lines rise steadily. GRPO increases from ~1100 to ~1300, while AIRL-S rises from ~1120 to ~1300.
- **Convergence**: Both lines meet at ~1300 by step 100.
3. **Late Phase (Steps 100–200)**:
- **GRPO (blue)**: Fluctuates between ~1300 and ~1450, with a peak at ~1450 near step 150.
- **AIRL-S (red)**: Fluctuates between ~1350 and ~1480, peaking at ~1480 near step 175.
- **Divergence**: AIRL-S consistently exceeds GRPO by ~50–100 units after step 100.
### Key Observations
- **GRPO (blue)** shows higher variability, with a sharp dip at step 50 and erratic fluctuations post-step 100.
- **AIRL-S (red)** demonstrates greater stability until step 100, followed by sustained higher response lengths.
- **Shaded Regions**: Indicate variability/confidence intervals around each line, with AIRL-S showing slightly narrower bands post-step 100.
### Interpretation
The data suggests that **AIRL-S with PRM** (red line) maintains higher and more stable response lengths compared to **GRPO without PRM** (blue line). The PRM component likely mitigates the instability observed in GRPO, particularly after step 100. The divergence post-step 100 implies that PRM enhances performance in later stages, possibly through improved optimization or regularization. The initial dip in GRPO may reflect a transient inefficiency or adaptation phase absent in AIRL-S. This trend highlights the importance of PRM in stabilizing response lengths for the AIRL-S method.