## Diagram: Workflow for Automated Evaluation of Multimodal Models
### Overview
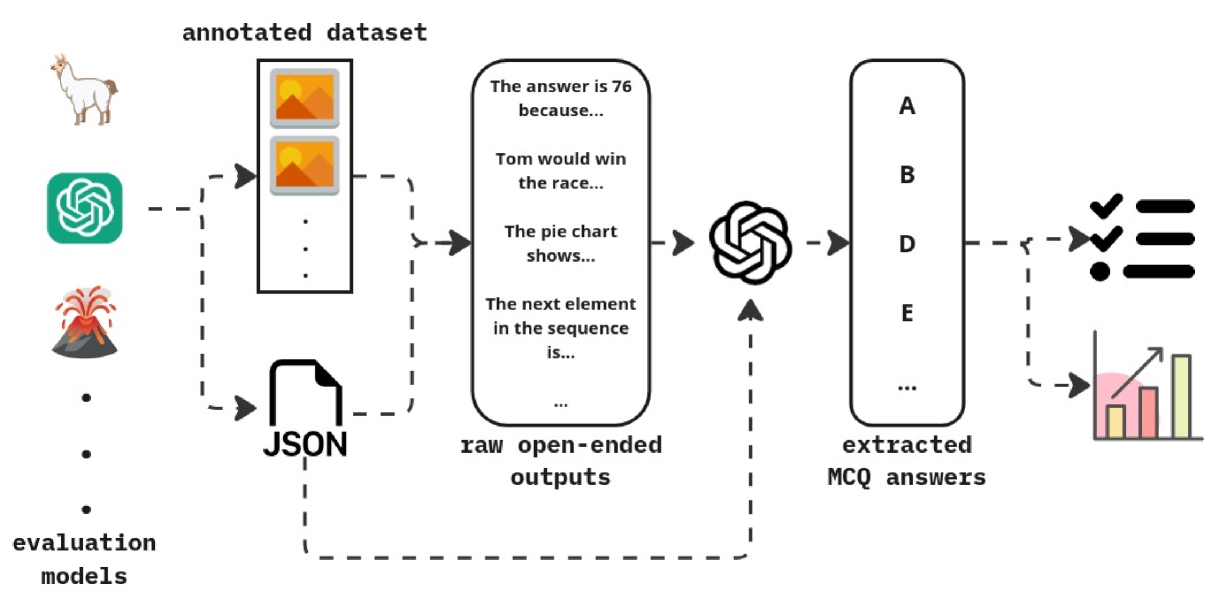
This diagram illustrates a multi-stage pipeline designed to evaluate the performance of various AI models (referred to as "evaluation models"). The process involves taking raw, open-ended text responses generated by these models based on an annotated dataset and converting them into structured, standardized Multiple Choice Question (MCQ) answers using a secondary extraction model (ChatGPT).
### Components/Axes
**1. Input/Source (Left Column)**
* **Evaluation Models:** Represented by a vertical stack of icons:
* A Llama icon (representing Llama models).
* A ChatGPT logo.
* A Volcano icon (representing LLaVA, a vision-language model).
* Ellipses (...) indicating additional models.
* **Label:** "evaluation models" (positioned at the bottom left).
**2. Data Source (Middle-Left)**
* **Annotated Dataset:** A vertical rectangle containing two image icons, representing the input data.
* **JSON File:** A document icon labeled "JSON" positioned below the annotated dataset.
* **Label:** "annotated dataset" (positioned above the dataset box).
**3. Processing Stage 1 (Center)**
* **Raw Outputs:** A large rounded rectangle containing examples of verbose, open-ended text responses:
* "The answer is 76 because..."
* "Tom would win the race..."
* "The pie chart shows..."
* "The next element in the sequence is..."
* "..."
* **Label:** "raw open-ended outputs" (positioned below the rectangle).
**4. Processing Stage 2 (Center-Right)**
* **Extraction Model:** A ChatGPT logo acting as the processor.
**5. Output Stage (Right)**
* **Extracted Answers:** A vertical rounded rectangle containing standardized categorical labels:
* "A"
* "B"
* "D"
* "E"
* "..."
* **Label:** "extracted MCQ answers" (positioned below the rectangle).
**6. Final Visualization (Far Right)**
* **Icons:** A checklist icon and a bar chart icon, representing the final evaluation metrics.
### Detailed Analysis
The workflow follows a specific logical sequence indicated by dashed arrows:
1. **Generation:** The "evaluation models" (Llama, ChatGPT, Volcano) process the "annotated dataset" (images + JSON metadata).
2. **Raw Output:** This interaction produces "raw open-ended outputs" (verbose text).
3. **Extraction:** The "raw open-ended outputs" are fed into a ChatGPT instance. Simultaneously, the "JSON" file provides structural context to this ChatGPT instance.
4. **Standardization:** ChatGPT parses the verbose text and the JSON data to produce "extracted MCQ answers" (A, B, D, E).
5. **Finalization:** These extracted answers are then converted into final evaluation formats, represented by the checklist and bar chart icons.
### Key Observations
* **Two-Step Evaluation:** The process explicitly separates the *generation* of answers (by the evaluation models) from the *extraction/grading* of answers (by ChatGPT).
* **Data Enrichment:** The JSON file is used as a secondary input to the extraction model, likely providing the ground truth or the specific question format required to map the raw text to an MCQ option.
* **Standardization:** The primary purpose of the pipeline is to transform unstructured, natural language responses into structured, quantifiable data (MCQs).
### Interpretation
This diagram depicts a common methodology in the evaluation of Large Multimodal Models (LMMs).
Because LMMs often produce verbose, conversational, or inconsistent text responses, it is difficult to automatically grade them against a standard answer key. This pipeline solves that problem by using a "grader" model (ChatGPT) to act as an intermediary. The grader reads the verbose output from the evaluation model and maps it to a specific, standardized choice (A, B, D, E).
This allows researchers to convert qualitative, open-ended model behavior into quantitative metrics (represented by the bar chart and checklist at the end), enabling objective performance comparisons between different models. The inclusion of the JSON file suggests that the extraction process is guided by metadata, ensuring the grader knows exactly what the "correct" answer format should be for any given input.