## Diagram: Data Processing Pipeline for Question Answering
### Overview
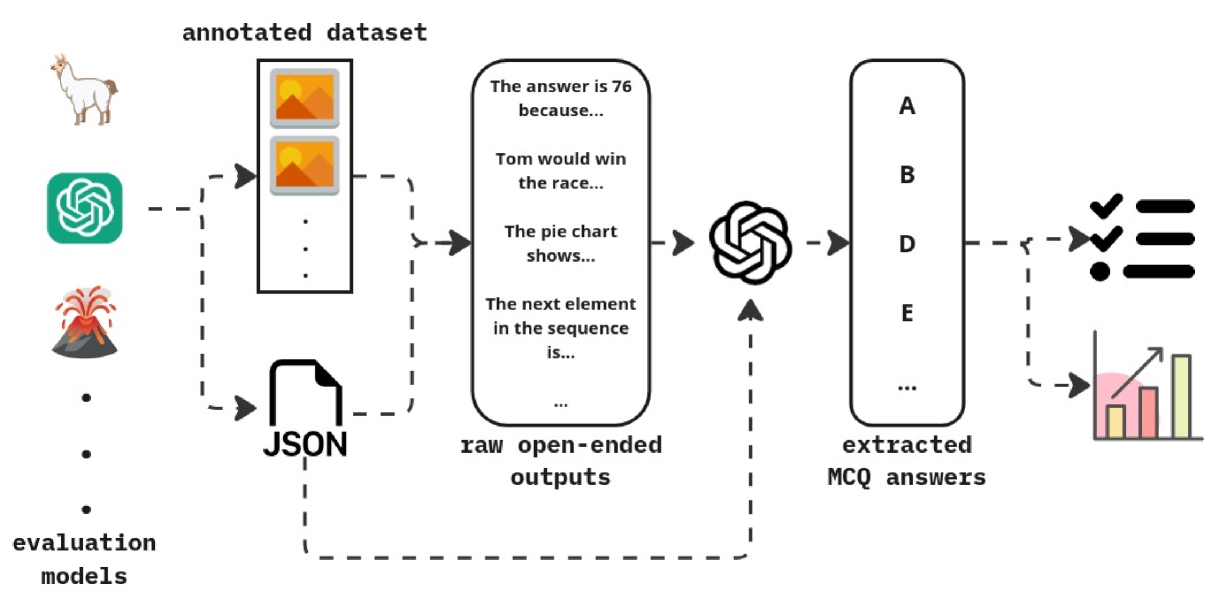
The image illustrates a data processing pipeline for question answering, starting from an annotated dataset and evaluation models, processing raw open-ended outputs, extracting multiple-choice question (MCQ) answers, and finally generating a performance analysis.
### Components/Axes
* **annotated dataset**: Located at the top-left, represented by images and a llama icon.
* **evaluation models**: Located at the bottom-left, represented by a volcano icon and the text "evaluation models".
* **JSON**: A JSON file icon is present, connected to the "raw open-ended outputs" block.
* **raw open-ended outputs**: A rounded rectangle in the center containing example outputs: "The answer is 76 because...", "Tom would win the race...", "The pie chart shows...", "The next element in the sequence is...".
* **extracted MCQ answers**: A rounded rectangle to the right of "raw open-ended outputs" containing MCQ answer options: "A", "B", "D", "E", and "...".
* **Performance Analysis**: Located at the bottom-right, represented by a checklist icon and a bar graph.
### Detailed Analysis or ### Content Details
1. **Data Flow**: The pipeline starts with an "annotated dataset" and "evaluation models".
2. **Input**: The "annotated dataset" and "JSON" file feed into the "raw open-ended outputs".
3. **Processing**: The "raw open-ended outputs" are processed, likely by a model represented by a stylized icon resembling a swirling symbol.
4. **Output**: The processed data results in "extracted MCQ answers".
5. **Evaluation**: The "extracted MCQ answers" are used to generate a performance analysis, represented by a checklist and a bar graph.
### Key Observations
* The diagram uses icons and text to represent different stages of the data processing pipeline.
* Dashed arrows indicate the flow of data between components.
* The "raw open-ended outputs" block provides examples of the type of text data being processed.
* The "extracted MCQ answers" block shows the format of the output after processing.
### Interpretation
The diagram illustrates a typical question-answering pipeline. The "annotated dataset" provides the initial data, which is then processed to generate open-ended outputs. These outputs are further processed to extract MCQ answers, which are then evaluated to assess the performance of the system. The "evaluation models" likely provide a benchmark for assessing the quality of the extracted answers. The JSON file likely contains metadata or configuration information for the pipeline. The diagram highlights the key steps involved in the process, from data input to performance evaluation.