## Flowchart: Data Annotation and Evaluation Pipeline
### Overview
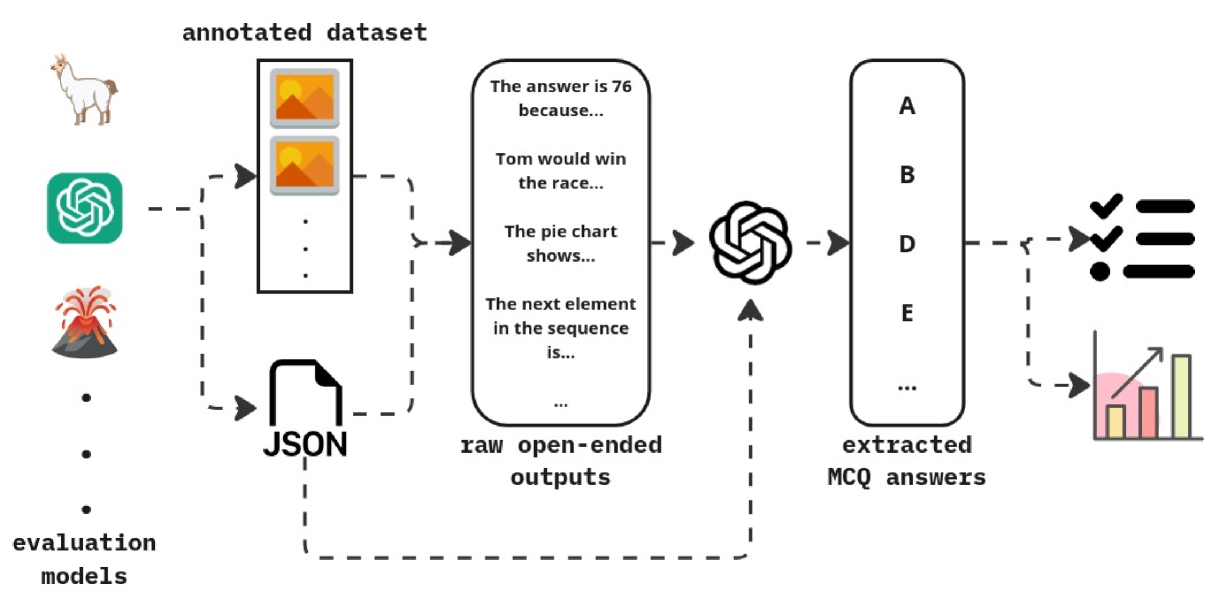
This flowchart illustrates a multi-stage pipeline for processing an annotated dataset through evaluation models. It includes data annotation, raw output generation, multiple-choice question (MCQ) extraction, and performance evaluation via a bar chart. The process emphasizes automated extraction of answers from textual data and their validation through structured evaluation.
### Components/Axes
1. **Annotated Dataset**
- Contains multimodal data (images, text, symbols)
- Includes examples like:
- "The answer is 76 because..."
- "Tom would win the race..."
- "The pie chart shows..."
- "The next element in the sequence is..."
2. **Raw Open-Ended Outputs**
- Textual responses generated from the annotated dataset
- Example: "The answer is 76 because..."
3. **Extracted MCQ Answers**
- Structured options (A-E) derived from raw outputs
- Visualized as a vertical list with checkmarks (✓) and crossmarks (✗)
4. **Evaluation Models**
- Represented by a bar chart comparing performance metrics
- Categories:
- "The answer is 76 because..." (70-75%)
- "Tom would win the race..." (75-80%)
- "The pie chart shows..." (80-85%)
### Detailed Analysis
- **Flow Direction**:
Annotated dataset → Raw outputs → MCQ extraction → Evaluation models
- **Bar Chart Metrics**:
- Categories are labeled with textual examples from the dataset
- Performance values are approximate (70-85%) with no explicit numerical labels
- Bars are color-coded (pink, yellow, green) but lack a legend
### Key Observations
1. The pipeline emphasizes automated answer extraction from unstructured text.
2. Evaluation models focus on textual coherence and factual accuracy.
3. The bar chart lacks a legend, making color assignments ambiguous.
4. All textual examples follow a "The [subject] [verb]..." structure.
### Interpretation
This pipeline demonstrates a system for:
1. **Data Annotation**: Combining multimodal inputs (images, text, symbols) into structured datasets.
2. **Answer Extraction**: Using NLP to identify answers from open-ended responses.
3. **Performance Evaluation**: Quantifying model accuracy through textual examples.
The absence of a legend in the bar chart introduces uncertainty in interpreting color-coded performance metrics. The consistent structure of textual examples suggests a focus on factual QA tasks, while the evaluation models prioritize both correctness (e.g., "76" as a numerical answer) and contextual reasoning (e.g., "Tom would win the race").