## Heatmap: Confidence Progression
### Overview
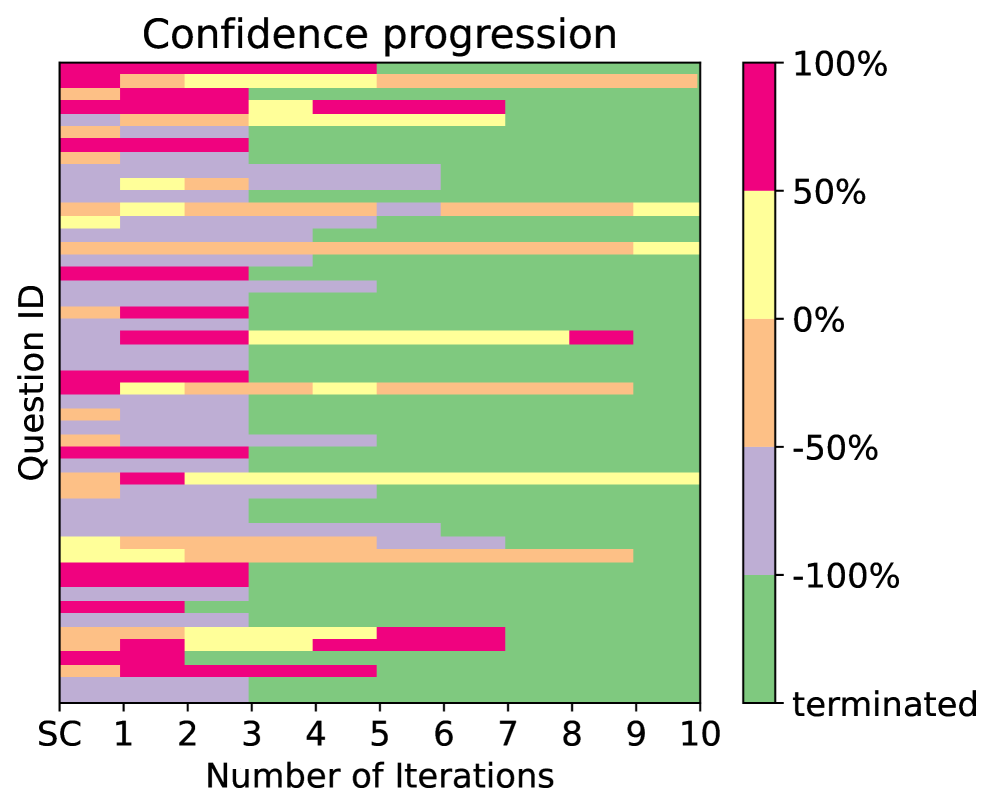
The image presents a heatmap visualizing the confidence progression across multiple questions (identified by "Question ID") over a series of iterations (numbered 1 to 10). The color scale represents confidence levels, ranging from -100% to 100%, with green indicating a confidence of 0%. The heatmap also indicates when a question is "terminated".
### Components/Axes
* **Title:** "Confidence progression" (top-center)
* **X-axis:** "Number of Iterations" (bottom-center), ranging from "SC" (likely representing a starting condition) to 10.
* **Y-axis:** "Question ID" (left-side), with 7 distinct questions represented.
* **Color Scale/Legend:** Located on the right side of the heatmap.
* 100% (Magenta)
* 50% (Yellow)
* 0% (Green)
* -50% (Light Blue)
* -100% (Dark Red)
* terminated (Grey)
### Detailed Analysis
The heatmap displays confidence levels for each question across iterations. The confidence is represented by the color of each cell.
* **Question 1:** Starts with a confidence around +50% (yellow), dips to around -50% (light blue) by iteration 3, then fluctuates between -50% and +50% before terminating around iteration 8.
* **Question 2:** Begins with a confidence around +50% (yellow), increases to approximately +80% (approaching magenta) by iteration 2, then decreases to around 0% (green) by iteration 6, and terminates around iteration 7.
* **Question 3:** Starts with a confidence around -50% (light blue), increases to approximately +50% (yellow) by iteration 3, then decreases to around -50% (light blue) by iteration 7, and terminates around iteration 9.
* **Question 4:** Starts with a confidence around -50% (light blue), increases to approximately 0% (green) by iteration 2, then decreases to around -100% (dark red) by iteration 5, and terminates around iteration 6.
* **Question 5:** Begins with a confidence around +50% (yellow), increases to approximately +80% (approaching magenta) by iteration 2, then decreases to around 0% (green) by iteration 6, and terminates around iteration 8.
* **Question 6:** Starts with a confidence around -100% (dark red), increases to approximately 0% (green) by iteration 3, then fluctuates between -50% and +50% before terminating around iteration 7.
* **Question 7:** Begins with a confidence around +50% (yellow), increases to approximately +80% (approaching magenta) by iteration 2, then decreases to around 0% (green) by iteration 6, and terminates around iteration 9.
The "SC" column (starting condition) shows initial confidence levels for each question.
### Key Observations
* Most questions exhibit fluctuating confidence levels over iterations.
* Several questions start with negative confidence and attempt to improve.
* Termination occurs at different iterations for each question.
* There is a general trend of confidence decreasing over time for some questions.
* Questions 2, 5, and 7 show a similar pattern of initial high confidence followed by a decline.
### Interpretation
This heatmap likely represents the confidence of a model or system in answering a set of questions over multiple iterations of a learning or refinement process. The "terminated" status suggests that the system stopped processing a question when its confidence fell below a certain threshold or reached a maximum iteration limit.
The varying confidence trajectories indicate that some questions are easier to resolve than others. The initial high confidence followed by a decline in questions 2, 5, and 7 could suggest that the system initially makes a strong prediction but then encounters contradictory evidence or complexities that reduce its certainty. The questions starting with low confidence (1, 3, 4, 6, 7) may be inherently more difficult or require more iterations to achieve a reasonable level of confidence.
The data suggests that the system is not consistently improving its confidence across all questions. Some questions are successfully resolved (terminated with reasonable confidence), while others struggle and are eventually terminated with low confidence. This could indicate the need for adjustments to the learning algorithm, the input data, or the question set itself. The heatmap provides a valuable visual overview of the system's performance and highlights areas for further investigation.