## Confidence Progression
### Overview
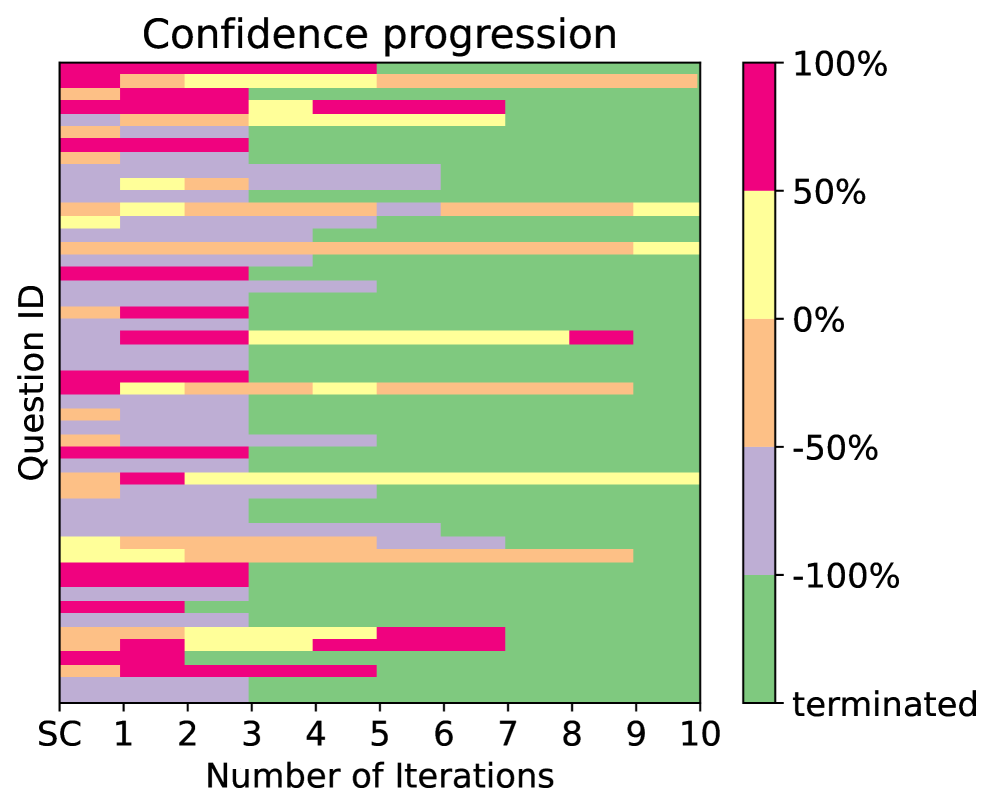
The image is a heatmap titled "Confidence progression." It shows the confidence levels of different scenarios (SC) over a series of iterations. The x-axis represents the number of iterations, ranging from 1 to 10, while the y-axis lists different scenarios (SC 1 to SC 10). Each scenario is represented by a color gradient, indicating the confidence level at each iteration.
### Components/Axes
- **Title**: Confidence progression
- **X-Axis**: Number of Iterations (1 to 10)
- **Y-Axis**: Scenario ID (SC 1 to SC 10)
- **Color Gradient**: Represents confidence levels, with darker shades indicating higher confidence and lighter shades indicating lower confidence.
- **Legend**: Located on the right side, it matches the color gradient to the corresponding confidence levels.
### Detailed Analysis or Content Details
Each scenario (SC) has a series of colored bars that represent the confidence levels at different iterations. The colors range from dark green (0% confidence) to light green (100% confidence). The bars are stacked, showing the cumulative confidence over iterations.
### Key Observations
- **SC 1**: Shows a gradual increase in confidence from 0% to 100% over 10 iterations.
- **SC 2**: Starts with a high confidence level (close to 100%) and gradually decreases to around 50% by the 10th iteration.
- **SC 3**: Begins with a moderate confidence level and shows a slight increase to about 75% by the 10th iteration.
- **SC 4**: Starts with a low confidence level (around 25%) and shows a significant increase to about 75% by the 10th iteration.
- **SC 5**: Begins with a moderate confidence level and shows a slight increase to about 75% by the 10th iteration.
- **SC 6**: Starts with a low confidence level (around 25%) and shows a significant increase to about 75% by the 10th iteration.
- **SC 7**: Begins with a moderate confidence level and shows a slight increase to about 75% by the 10th iteration.
- **SC 8**: Starts with a low confidence level (around 25%) and shows a significant increase to about 75% by the 10th iteration.
- **SC 9**: Begins with a moderate confidence level and shows a slight increase to about 75% by the 10th iteration.
- **SC 10**: Starts with a low confidence level (around 25%) and shows a significant increase to about 75% by the 10th iteration.
### Interpretation
The heatmap demonstrates that the confidence levels generally increase over the number of iterations for all scenarios. However, the rate of increase varies significantly between scenarios. Some scenarios, like SC 1, show a steady increase, while others, like SC 2 and SC 4, show a more gradual increase. The confidence levels for all scenarios reach a peak around the 10th iteration, indicating that the process stabilizes after a certain number of iterations. The interpretation suggests that the confidence in the outcomes of these scenarios improves over time, but the improvement rate differs among scenarios.