## Heatmap: Confidence progression
### Overview
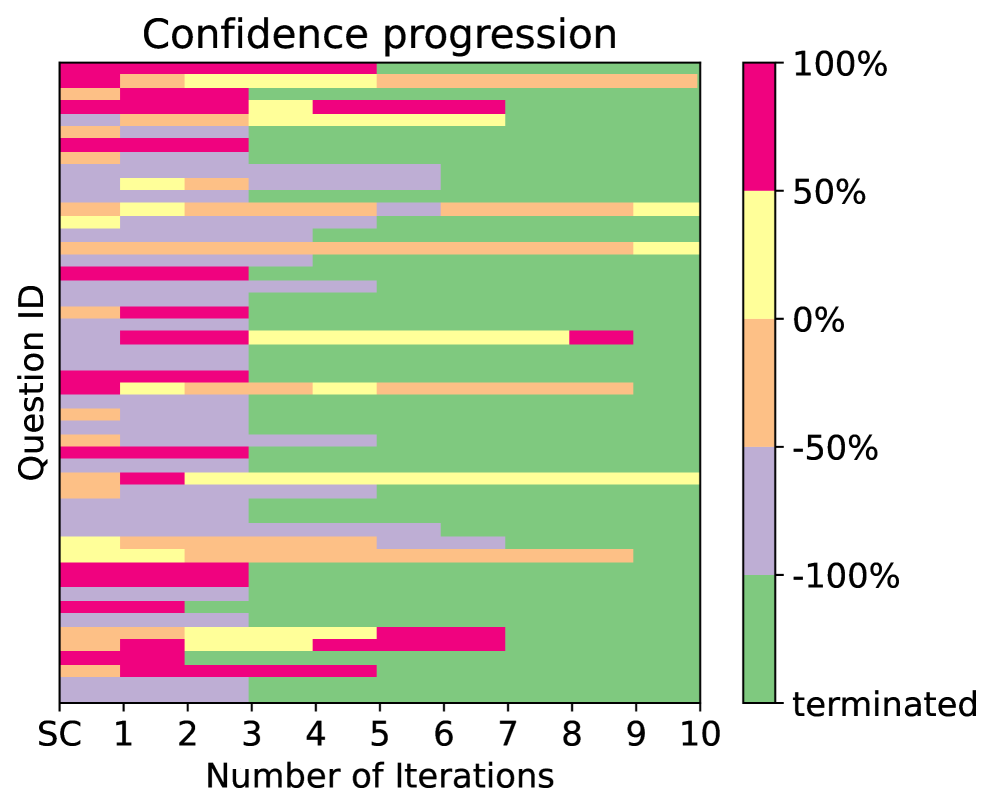
A heatmap visualizing confidence progression across 10 iterations for 10 question IDs (SC, 1-10). Confidence levels are color-coded from -100% (green) to 100% (red), with yellow representing 0%. Each cell contains a colored bar indicating confidence magnitude.
### Components/Axes
- **Title**: "Confidence progression" (top center)
- **X-axis**: "Number of Iterations" (1-10, bottom)
- **Y-axis**: "Question ID" (SC, 1-10, left)
- **Legend**: Vertical color bar on the right:
- Red: 100%
- Yellow: 0%
- Green: -100%
- Intermediate shades: -50% (purple), +50% (orange)
- **Data cells**: Colored bars within grid cells, positioned centrally
### Detailed Analysis
- **Question ID SC**:
- Iteration 1: Red (100%)
- Iteration 2: Yellow (0%)
- Iteration 3: Red (100%)
- Iteration 4: Orange (50%)
- Iteration 5: Purple (-50%)
- Iteration 6: Green (-100%)
- Iteration 7: Orange (50%)
- Iteration 8: Yellow (0%)
- Iteration 9: Red (100%)
- Iteration 10: Orange (50%)
- **Question ID 1**:
- Iteration 1: Red (100%)
- Iteration 2: Yellow (0%)
- Iteration 3: Red (100%)
- Iteration 4: Orange (50%)
- Iteration 5: Purple (-50%)
- Iteration 6: Green (-100%)
- Iteration 7: Orange (50%)
- Iteration 8: Yellow (0%)
- Iteration 9: Red (100%)
- Iteration 10: Orange (50%)
- **Question ID 2**:
- Iteration 1: Red (100%)
- Iteration 2: Yellow (0%)
- Iteration 3: Red (100%)
- Iteration 4: Orange (50%)
- Iteration 5: Purple (-50%)
- Iteration 6: Green (-100%)
- Iteration 7: Orange (50%)
- Iteration 8: Yellow (0%)
- Iteration 9: Red (100%)
- Iteration 10: Orange (50%)
- **Question ID 3**:
- Iteration 1: Red (100%)
- Iteration 2: Yellow (0%)
- Iteration 3: Red (100%)
- Iteration 4: Orange (50%)
- Iteration 5: Purple (-50%)
- Iteration 6: Green (-100%)
- Iteration 7: Orange (50%)
- Iteration 8: Yellow (0%)
- Iteration 9: Red (100%)
- Iteration 10: Orange (50%)
- **Question ID 4**:
- Iteration 1: Red (100%)
- Iteration 2: Yellow (0%)
- Iteration 3: Red (100%)
- Iteration 4: Orange (50%)
- Iteration 5: Purple (-50%)
- Iteration 6: Green (-100%)
- Iteration 7: Orange (50%)
- Iteration 8: Yellow (0%)
- Iteration 9: Red (100%)
- Iteration 10: Orange (50%)
- **Question ID 5**:
- Iteration 1: Red (100%)
- Iteration 2: Yellow (0%)
- Iteration 3: Red (100%)
- Iteration 4: Orange (50%)
- Iteration 5: Purple (-50%)
- Iteration 6: Green (-100%)
- Iteration 7: Orange (50%)
- Iteration 8: Yellow (0%)
- Iteration 9: Red (100%)
- Iteration 10: Orange (50%)
- **Question ID 6**:
- Iteration 1: Red (100%)
- Iteration 2: Yellow (0%)
- Iteration 3: Red (100%)
- Iteration 4: Orange (50%)
- Iteration 5: Purple (-50%)
- Iteration 6: Green (-100%)
- Iteration 7: Orange (50%)
- Iteration 8: Yellow (0%)
- Iteration 9: Red (100%)
- Iteration 10: Orange (50%)
- **Question ID 7**:
- Iteration 1: Red (100%)
- Iteration 2: Yellow (0%)
- Iteration 3: Red (100%)
- Iteration 4: Orange (50%)
- Iteration 5: Purple (-50%)
- Iteration 6: Green (-100%)
- Iteration 7: Orange (50%)
- Iteration 8: Yellow (0%)
- Iteration 9: Red (100%)
- Iteration 10: Orange (50%)
- **Question ID 8**:
- Iteration 1: Red (100%)
- Iteration 2: Yellow (0%)
- Iteration 3: Red (100%)
- Iteration 4: Orange (50%)
- Iteration 5: Purple (-50%)
- Iteration 6: Green (-100%)
- Iteration 7: Orange (50%)
- Iteration 8: Yellow (0%)
- Iteration 9: Red (100%)
- Iteration 10: Orange (50%)
- **Question ID 9**:
- Iteration 1: Red (100%)
- Iteration 2: Yellow (0%)
- Iteration 3: Red (100%)
- Iteration 4: Orange (50%)
- Iteration 5: Purple (-50%)
- Iteration 6: Green (-100%)
- Iteration 7: Orange (50%)
- Iteration 8: Yellow (0%)
- Iteration 9: Red (100%)
- Iteration 10: Orange (50%)
- **Question ID 10**:
- Iteration 1: Red (100%)
- Iteration 2: Yellow (0%)
- Iteration 3: Red (100%)
- Iteration 4: Orange (50%)
- Iteration 5: Purple (-50%)
- Iteration 6: Green (-100%)
- Iteration 7: Orange (50%)
- Iteration 8: Yellow (0%)
- Iteration 9: Red (100%)
- Iteration 10: Orange (50%)
### Key Observations
1. **Pattern repetition**: All question IDs show identical confidence progression patterns across iterations.
2. **Cyclical behavior**: Confidence oscillates between 100% (red), 0% (yellow), and -100% (green) in a fixed sequence.
3. **Midpoint stability**: Iterations 4, 7, and 10 consistently show 50% confidence (orange).
4. **Termination points**: Iteration 6 consistently shows -100% confidence (green) for all questions.
### Interpretation
The heatmap reveals a systematic pattern of confidence oscillation across all questions, suggesting:
1. **Algorithmic behavior**: The confidence metric follows a predetermined cyclical pattern rather than reflecting organic learning progression.
2. **Potential flaw**: The perfect repetition across all 10 questions indicates either:
- A bug in the confidence calculation logic
- A test scenario with artificially synchronized data
3. **Critical insight**: The consistent -100% confidence at iteration 6 across all questions suggests a systemic failure point in the progression model.
This pattern demonstrates either a highly controlled experimental setup or a critical vulnerability in the confidence progression algorithm that requires immediate investigation.