\n
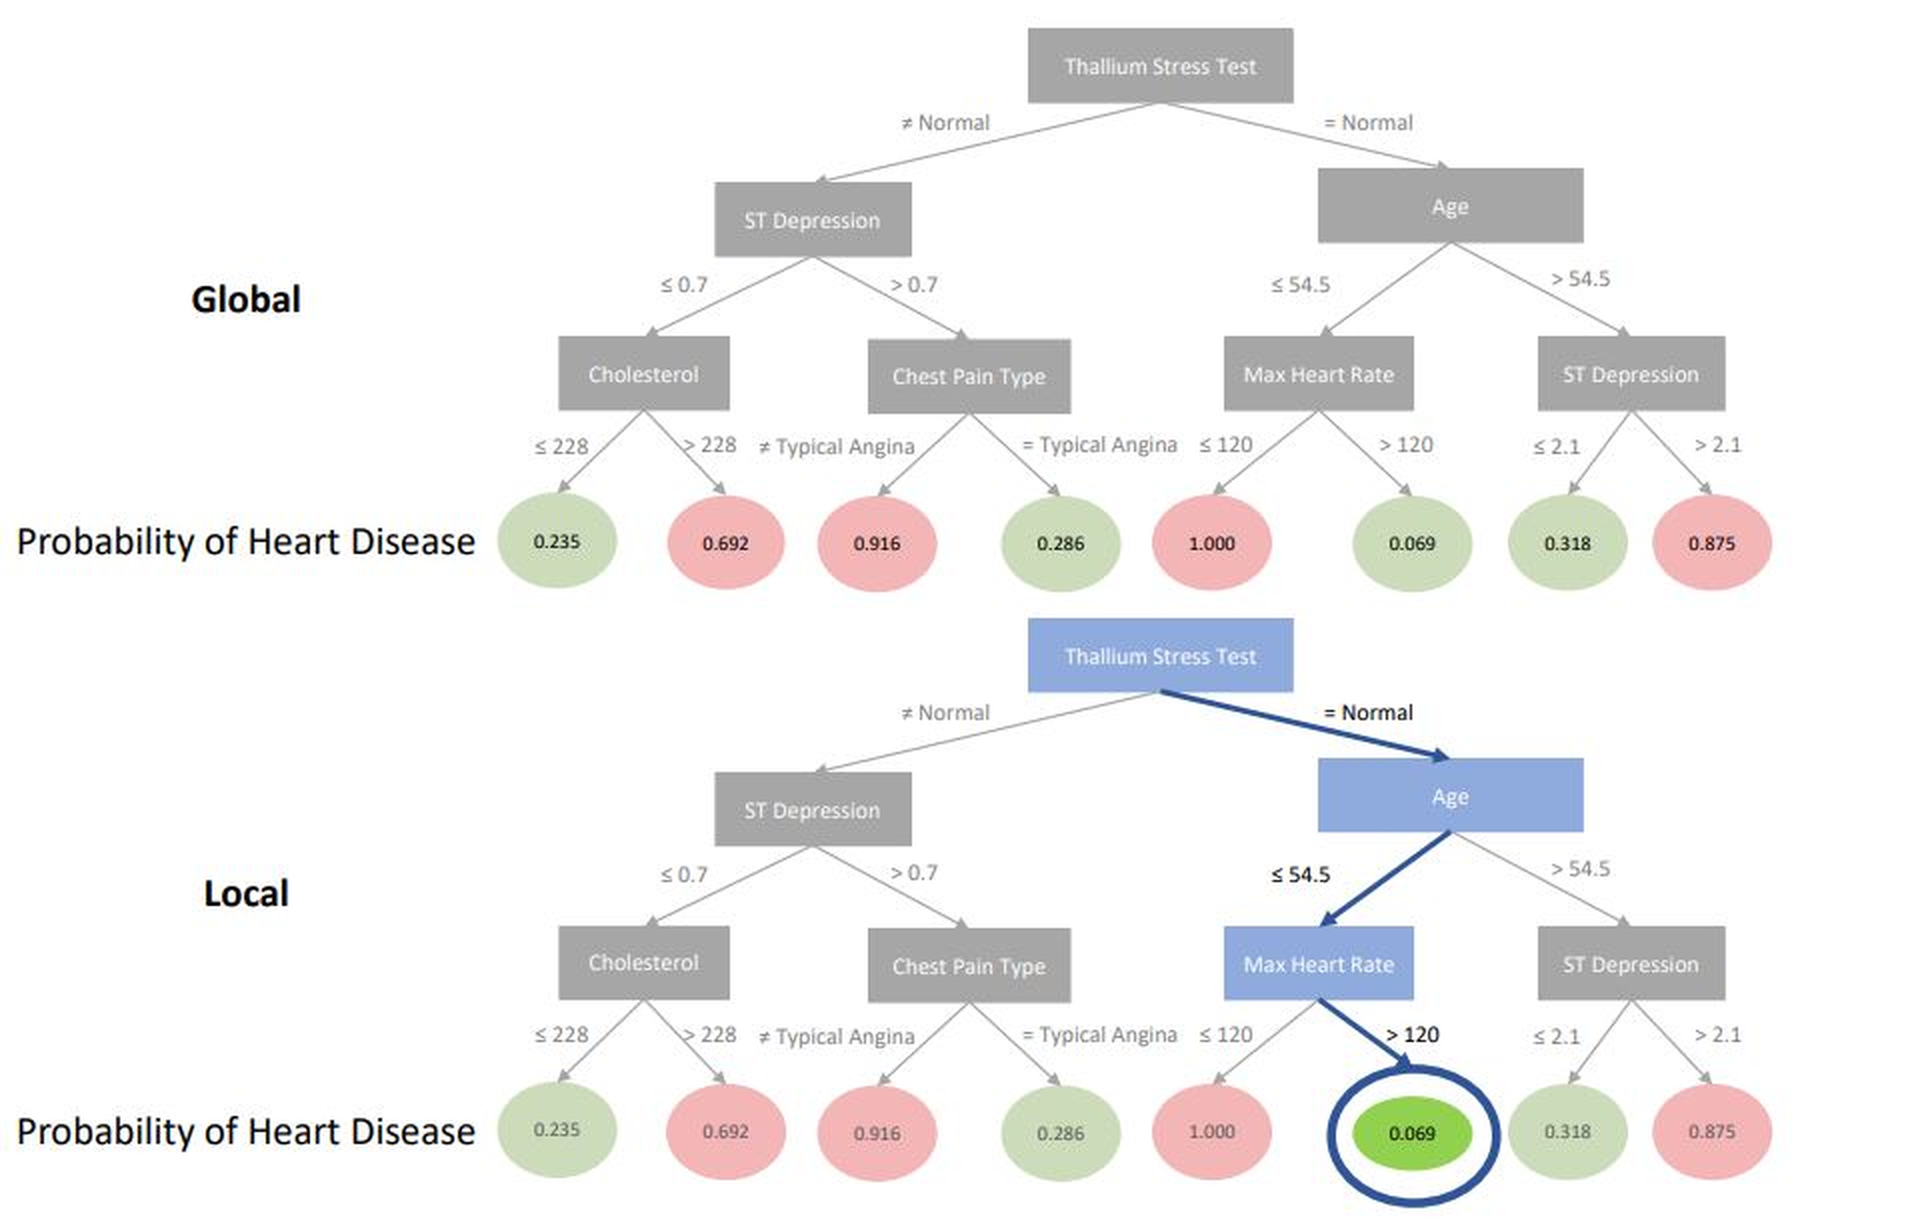
## Decision Tree: Probability of Heart Disease
### Overview
The image presents two decision trees, labeled "Global" and "Local", both aiming to predict the probability of heart disease based on a series of medical tests and patient characteristics. The trees visually represent a series of binary decisions leading to a final probability estimate. Both trees have identical structure and values.
### Components/Axes
The decision trees are structured with nodes representing tests or characteristics, and branches representing the outcomes of those tests. The leaf nodes represent the estimated probability of heart disease. The following characteristics are used:
* **Thallium Stress Test:** Normal vs. Not Normal
* **ST Depression:** ≤ 0.7 vs. > 0.7
* **Age:** ≤ 54.5 vs. > 54.5
* **Cholesterol:** ≤ 228 vs. > 228
* **Chest Pain Type:** Typical Angina vs. Atypical Angina
* **Max Heart Rate:** ≤ 120 vs. > 120
* **ST Depression:** ≤ 2.1 vs. > 2.1
The final probabilities are displayed at the leaf nodes. The trees are labeled "Global" and "Local" at the top-left. The phrase "Probability of Heart Disease" is present at the bottom-left of each tree.
### Detailed Analysis or Content Details
Both trees are identical, so the analysis will cover one tree. The tree starts with the "Thallium Stress Test".
* **Thallium Stress Test = Normal:** The tree branches to "Age".
* **Age ≤ 54.5:** Branches to "Cholesterol".
* **Cholesterol ≤ 228:** Probability = 0.235
* **Cholesterol > 228:** Probability = 0.692
* **Age > 54.5:** Branches to "ST Depression".
* **ST Depression ≤ 2.1:** Probability = 0.318
* **ST Depression > 2.1:** Probability = 0.875
* **Thallium Stress Test ≠ Normal:** The tree branches to "ST Depression".
* **ST Depression ≤ 0.7:** Branches to "Chest Pain Type".
* **Chest Pain Type = Typical Angina:** Probability = 0.916
* **Chest Pain Type = Atypical Angina:** Probability = 0.286
* **ST Depression > 0.7:** Branches to "Max Heart Rate".
* **Max Heart Rate ≤ 120:** Probability = 1.000
* **Max Heart Rate > 120:** Probability = 0.069
The probabilities are represented as numerical values within red-bordered circles. The "Local" tree has a green circle around the probability of 0.069.
### Key Observations
The probabilities vary significantly depending on the combination of factors. A "Normal" Thallium Stress Test generally indicates a lower probability of heart disease, while an "Abnormal" test often leads to higher probabilities. The "Max Heart Rate > 120" and "ST Depression > 0.7" combinations result in the highest probabilities (1.000 and 0.875 respectively). The "Local" tree highlights the probability of 0.069.
### Interpretation
The decision trees provide a simplified model for assessing the probability of heart disease based on a set of clinical variables. The structure of the tree suggests that the "Thallium Stress Test" is considered the most important initial indicator, followed by age, cholesterol, chest pain type, and max heart rate. The probabilities at the leaf nodes represent the estimated risk level for individuals falling into those specific categories. The highlighting of 0.069 in the "Local" tree suggests this value is of particular interest or represents a specific case being analyzed. The trees demonstrate a clear relationship between medical test results and the likelihood of heart disease, offering a visual representation of a diagnostic process. The identical structure of the "Global" and "Local" trees suggests they represent the same underlying model, potentially applied to different datasets or contexts.