\n
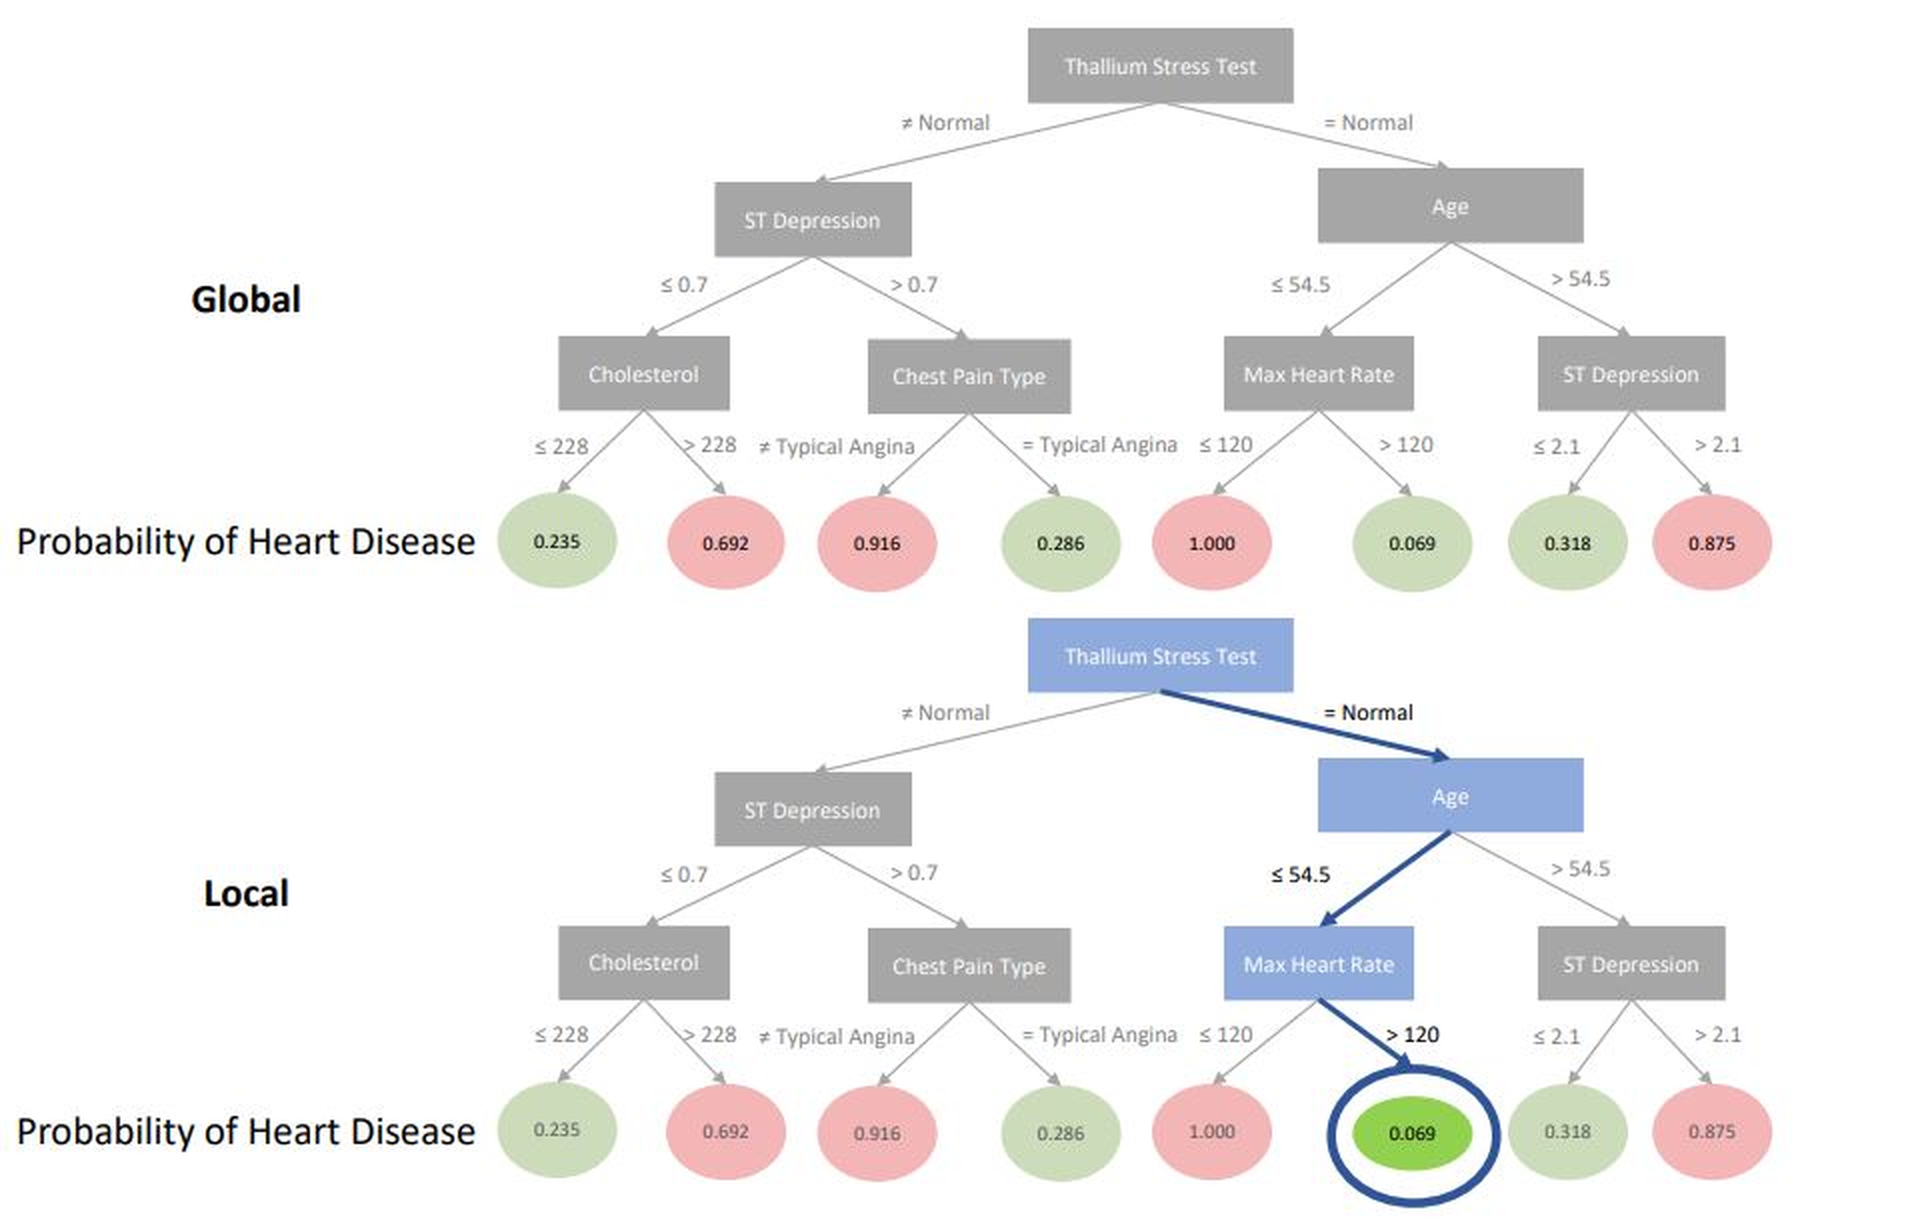
## Decision Tree Diagram: Heart Disease Probability Prediction
### Overview
The image displays two decision tree diagrams used to predict the probability of heart disease based on patient medical data. The top tree is labeled "Global," representing the overall model structure. The bottom tree is labeled "Local," highlighting a specific decision path for an individual case. Both trees share the same structure and leaf node probabilities but differ in visual emphasis.
### Components/Axes
**Structure:** Hierarchical decision trees with nodes and branches.
**Root Node (Both Trees):** "Thallium Stress Test"
**Decision Nodes (Grey Rectangles):**
- ST Depression
- Age
- Cholesterol
- Chest Pain Type
- Max Heart Rate
**Leaf Nodes (Circles):** Contain the predicted "Probability of Heart Disease." Nodes are color-coded:
- **Green:** Lower probability values.
- **Red:** Higher probability values.
**Branch Labels:** Conditions for splitting at each node (e.g., "≤ 0.7", "> 54.5", "= Typical Angina").
**Spatial Layout:**
- The "Global" tree occupies the top half of the image.
- The "Local" tree occupies the bottom half.
- In the "Local" tree, the decision path from the root to a specific leaf node is highlighted with **blue nodes and blue connecting lines**. The final leaf node in this path (value 0.069) is further emphasized with a **dark blue circle**.
### Detailed Analysis
**Tree Structure & Decision Paths:**
1. **Root Split:** Based on "Thallium Stress Test".
* Left Branch: "≠ Normal" → leads to "ST Depression" node.
* Right Branch: "= Normal" → leads to "Age" node.
2. **Left Subtree (Thallium ≠ Normal):**
* Node: "ST Depression"
* Left Branch: "≤ 0.7" → leads to "Cholesterol" node.
* Left Branch: "≤ 228" → **Leaf: 0.235 (Green)**
* Right Branch: "> 228" → **Leaf: 0.692 (Red)**
* Right Branch: "> 0.7" → leads to "Chest Pain Type" node.
* Left Branch: "≠ Typical Angina" → **Leaf: 0.916 (Red)**
* Right Branch: "= Typical Angina" → **Leaf: 0.286 (Green)**
3. **Right Subtree (Thallium = Normal):**
* Node: "Age"
* Left Branch: "≤ 54.5" → leads to "Max Heart Rate" node.
* Left Branch: "≤ 120" → **Leaf: 1.000 (Red)**
* Right Branch: "> 120" → **Leaf: 0.069 (Green)**
* Right Branch: "> 54.5" → leads to "ST Depression" node.
* Left Branch: "≤ 2.1" → **Leaf: 0.318 (Green)**
* Right Branch: "> 2.1" → **Leaf: 0.875 (Red)**
**"Local" Tree Highlighted Path:**
The blue path traces the following decisions for a specific instance:
1. Thallium Stress Test = **Normal** (Right branch from root).
2. Age ≤ **54.5** (Left branch from "Age" node).
3. Max Heart Rate > **120** (Right branch from "Max Heart Rate" node).
4. This leads to the leaf node with a probability of **0.069**, which is circled.
### Key Observations
1. **Probability Extremes:** The model outputs probabilities across the full range, from very low (0.069) to certainty (1.000).
2. **Color-Coding Logic:** Green leaves consistently correspond to probabilities below ~0.32, while red leaves correspond to probabilities above ~0.69. The leaf with probability 1.000 is red.
3. **Critical Splits:**
* A "Thallium Stress Test" result of "≠ Normal" generally leads to higher-risk branches, except when combined with "Chest Pain Type = Typical Angina" (0.286).
* For patients with a normal Thallium test and age ≤ 54.5, a "Max Heart Rate > 120" is associated with the lowest probability in the entire tree (0.069).
* For older patients (Age > 54.5) with a normal Thallium test, "ST Depression > 2.1" indicates high risk (0.875).
4. **Highlighted Path Significance:** The "Local" tree isolates a specific, low-risk patient profile: normal stress test, younger age, and high maximum heart rate.
### Interpretation
This diagram visualizes a machine learning model's logic for assessing heart disease risk. It demonstrates how different clinical features interact in a non-linear way to produce a risk score.
* **Model Function:** The tree acts as a flowchart for diagnosis. A clinician (or system) would input a patient's data and follow the branches to arrive at a probability estimate.
* **Feature Importance:** The root node ("Thallium Stress Test") is the most important initial splitter. Subsequent important features include "Age," "ST Depression," and "Max Heart Rate."
* **Non-Intuitive Relationships:** The path to the lowest probability (0.069) is noteworthy. It suggests that for younger patients with a normal stress test, achieving a high heart rate during exertion (>120) is a strong indicator of *low* risk, which may reflect good cardiovascular fitness.
* **Explainability:** The "Local" tree exemplifies model explainability techniques (like LIME or SHAP). It doesn't just give a prediction (0.069); it shows the exact reasoning path (Normal Thallium → Age ≤54.5 → Max HR >120) that led to that prediction for one individual, making the AI's decision transparent.
* **Clinical Context:** The features used (Thallium test, ST depression, cholesterol, chest pain type, age, max heart rate) are all standard indicators in cardiology, grounding the model in established medical knowledge. The tree structure makes the complex relationships between these factors interpretable.