## Flowchart: Heart Disease Risk Assessment Model
### Overview
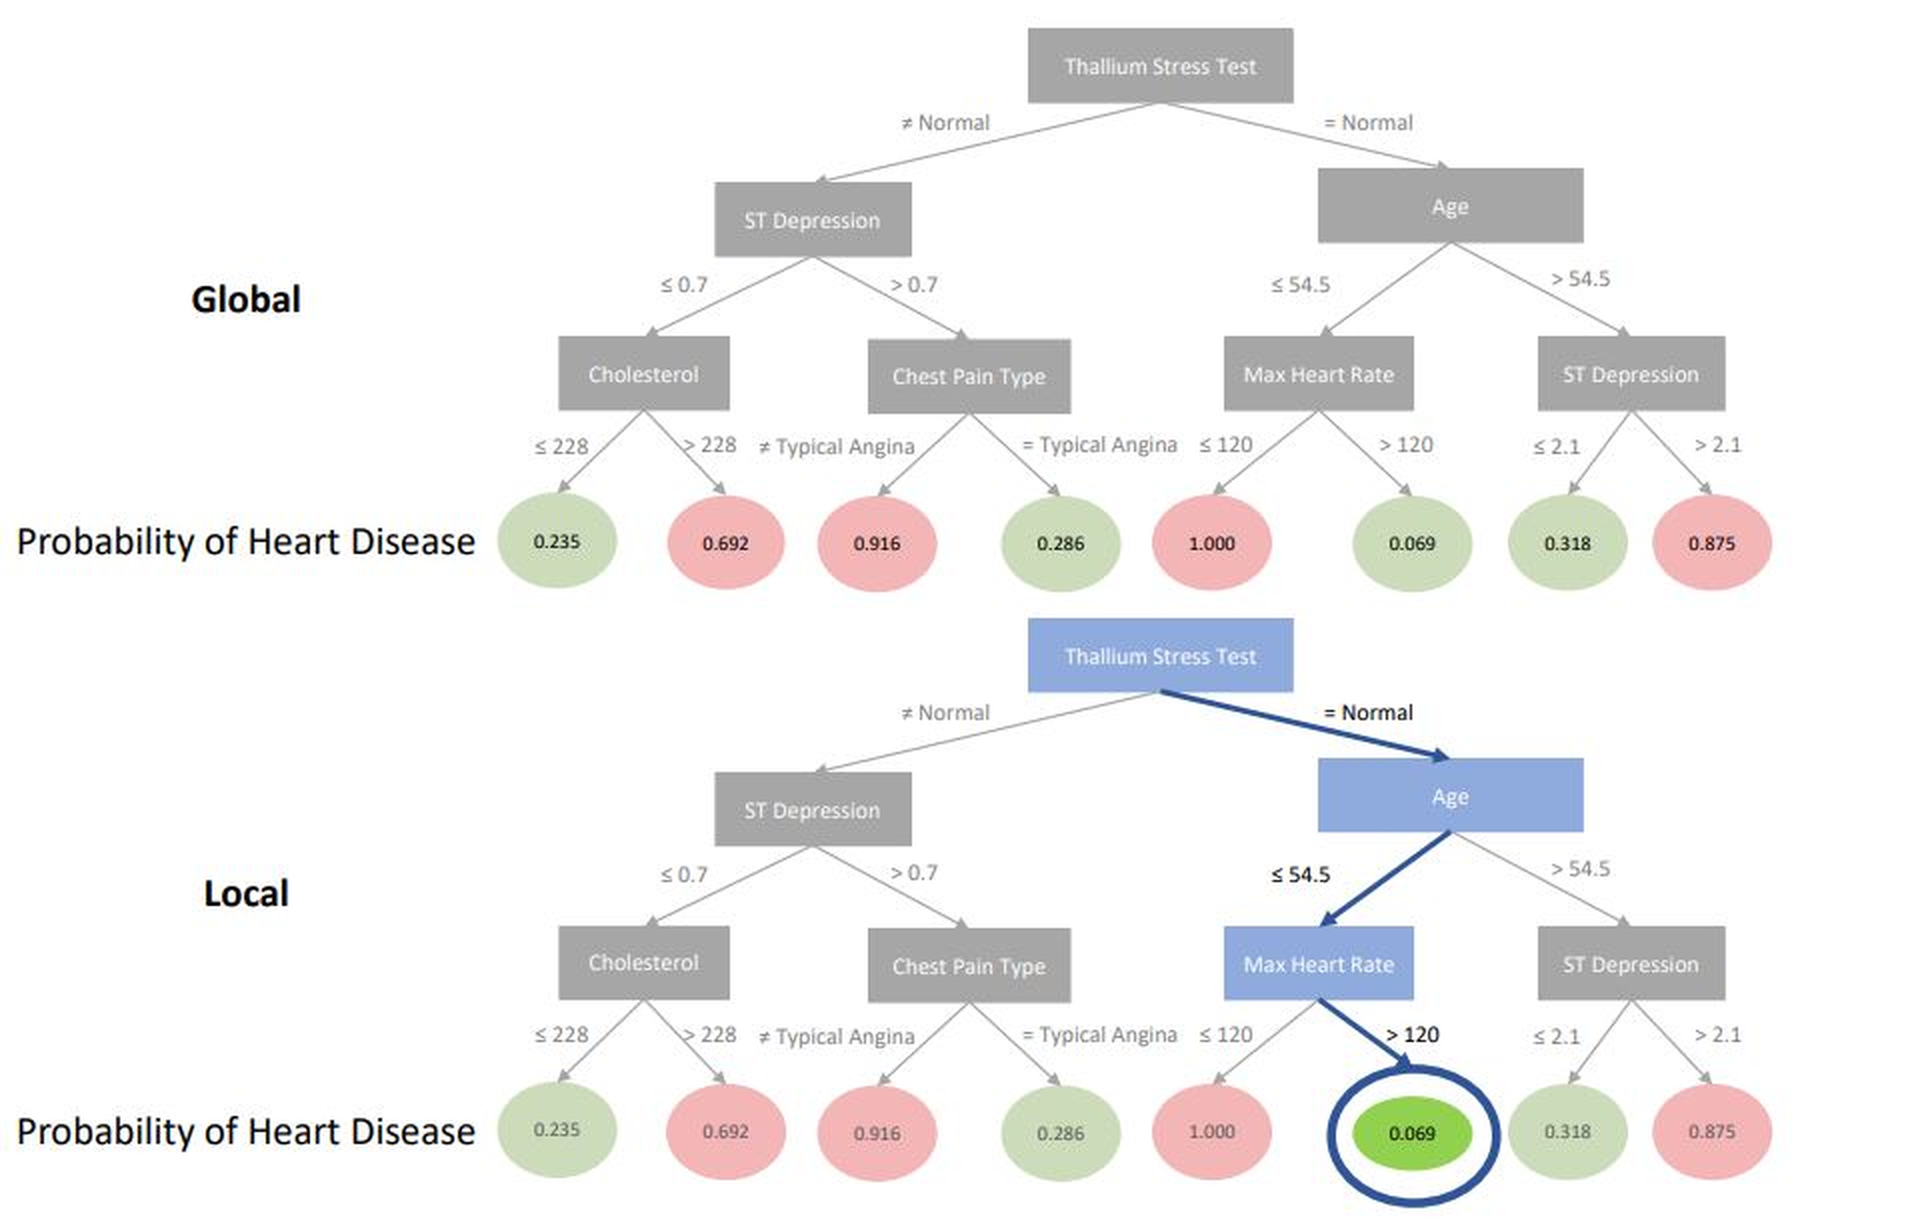
The image presents a bifurcated decision tree model comparing **Global** and **Local** heart disease risk assessment pathways. Both sections use color-coded nodes (green for "Normal" pathways, pink for "Abnormal") to represent conditional probabilities of heart disease based on clinical parameters. The Local section emphasizes a specific high-risk scenario through a circled probability value.
### Components/Axes
1. **Decision Nodes** (Gray/Blue Rectangles):
- Thallium Stress Test (Normal/Abnormal)
- ST Depression (≤0.7/≥0.7)
- Age (≤54.5/≥54.5)
- Cholesterol (≤228/≥228)
- Chest Pain Type (Typical/Non-Typical Angina)
- Max Heart Rate (≤120/≥120)
- ST Depression (≤2.1/≥2.1)
2. **Probability Nodes** (Circular):
- Green: Low-risk probabilities (0.069–0.318)
- Pink: High-risk probabilities (0.692–1.000)
- Special Case: Circled 0.069 in Local section
3. **Flow Structure**:
- Top-to-bottom hierarchy with conditional branching
- Divergent paths based on binary thresholds
- Convergent endpoints at probability values
### Detailed Analysis
#### Global Section (Top)
- **Thallium Stress Test**:
- Normal: Leads to Age assessment
- Abnormal: Triggers ST Depression evaluation
- **Age**:
- ≤54.5: Max Heart Rate assessment
- ≥54.5: ST Depression evaluation
- **Key Paths**:
- Cholesterol >228 + Non-Typical Angina: 0.916 probability
- Max Heart Rate >120: 0.069 probability
- ST Depression >2.1: 0.875 probability
#### Local Section (Bottom)
- **Modified Thallium Stress Test**:
- Normal: Directly branches to Age
- Abnormal: Maintains ST Depression evaluation
- **Critical Path**:
- Max Heart Rate >120: Circled 0.069 probability (highlighted anomaly)
- **Divergent Values**:
- Chest Pain Type: 0.286 (Global) vs 1.000 (Local)
- ST Depression >2.1: 0.875 (both sections)
### Key Observations
1. **Probability Extremes**:
- 1.000 probability in Global section (Cholesterol >228 + Non-Typical Angina)
- 0.069 circled value in Local section (Max Heart Rate >120)
2. **Threshold Sensitivity**:
- ST Depression thresholds differ between sections (0.7 vs 2.1)
- Age cutoff at 54.5 years creates bifurcation point
3. **Color Coding Consistency**:
- Green nodes consistently represent lower-risk pathways
- Pink nodes indicate higher-risk outcomes
### Interpretation
This flowchart demonstrates a **risk stratification model** where clinical parameters interact multiplicatively to predict heart disease probability. The **Local section's circled 0.069 value** suggests a critical threshold for Max Heart Rate >120, potentially indicating an outlier or high-priority clinical scenario.
The **Global model** shows higher probabilities (up to 1.000) for combinations involving Non-Typical Angina and elevated Cholesterol, while the **Local model** emphasizes Age-related risks. The divergence in Chest Pain Type probabilities (0.286 vs 1.000) between sections implies different risk weighting schemes for this parameter.
The model's binary threshold approach (e.g., ST Depression ≤0.7 vs ≥0.7) simplifies clinical decision-making but may overlook nuanced risk gradients. The consistent use of green/pink color coding across both sections reinforces the model's visual interpretability for clinicians.