## Line Chart: Accuracy vs. Sample Size for Three Methods
### Overview
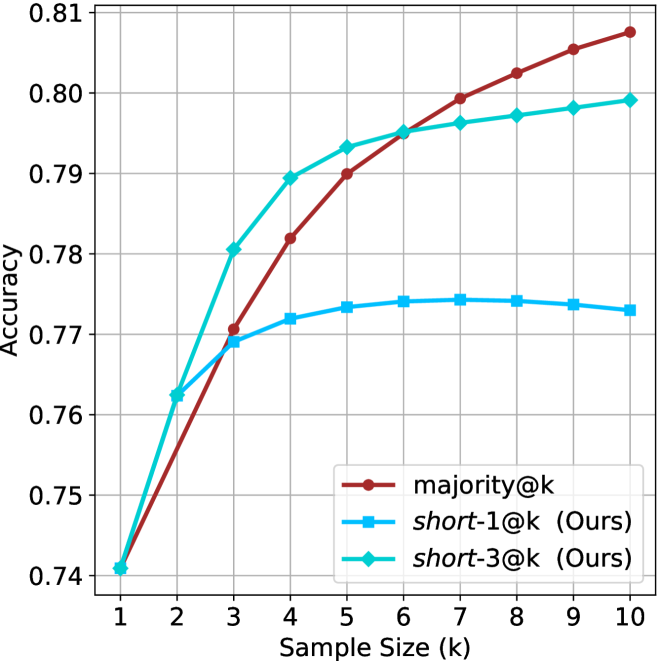
This line chart compares the performance (accuracy) of three different methods as a function of increasing sample size (`k`). The chart demonstrates how the accuracy of each method evolves from a sample size of 1 to 10.
### Components/Axes
* **X-Axis (Horizontal):** Labeled "Sample Size (k)". It has discrete integer markers from 1 to 10.
* **Y-Axis (Vertical):** Labeled "Accuracy". It has a linear scale ranging from 0.74 to 0.81, with major gridlines at intervals of 0.01.
* **Legend:** Located in the bottom-right corner of the plot area. It contains three entries:
1. `majority@k` - Represented by a dark red line with circular markers.
2. `short-1@k (Ours)` - Represented by a light blue line with square markers.
3. `short-3@k (Ours)` - Represented by a cyan line with diamond markers.
* **Grid:** A light gray grid is present, aiding in value estimation.
### Detailed Analysis
The chart plots three data series. Below is an analysis of each, including approximate values extracted from the chart. Values are estimated based on gridline positions.
**1. `majority@k` (Dark Red, Circles)**
* **Trend:** This line shows a strong, consistent upward trend. It starts as the lowest-performing method at k=1 but exhibits the steepest and most sustained growth, ultimately surpassing the other methods.
* **Data Points (Approximate):**
* k=1: 0.740
* k=2: 0.755
* k=3: 0.771
* k=4: 0.782
* k=5: 0.790
* k=6: 0.795
* k=7: 0.799
* k=8: 0.802
* k=9: 0.806
* k=10: 0.808
**2. `short-1@k (Ours)` (Light Blue, Squares)**
* **Trend:** This line shows initial growth that quickly plateaus. It rises from k=1 to k=4, then remains nearly flat with a very slight downward trend from k=7 to k=10.
* **Data Points (Approximate):**
* k=1: 0.740
* k=2: 0.762
* k=3: 0.769
* k=4: 0.772
* k=5: 0.773
* k=6: 0.774
* k=7: 0.774
* k=8: 0.774
* k=9: 0.773
* k=10: 0.773
**3. `short-3@k (Ours)` (Cyan, Diamonds)**
* **Trend:** This line shows strong initial growth, similar to `majority@k`, but its rate of improvement slows after k=5. It is overtaken by `majority@k` between k=6 and k=7.
* **Data Points (Approximate):**
* k=1: 0.740
* k=2: 0.762
* k=3: 0.780
* k=4: 0.789
* k=5: 0.793
* k=6: 0.795
* k=7: 0.796
* k=8: 0.797
* k=9: 0.798
* k=10: 0.799
### Key Observations
1. **Common Starting Point:** All three methods begin at the same accuracy point (~0.740) when the sample size (k) is 1.
2. **Crossover Point:** The `majority@k` line intersects and surpasses the `short-3@k` line between k=6 and k=7. Before this point, `short-3@k` is the top performer; after, `majority@k` is.
3. **Performance Plateau:** The `short-1@k` method shows the most pronounced plateau, with negligible accuracy gains after k=4.
4. **Final Ranking (k=10):** At the largest sample size shown, the order from highest to lowest accuracy is: `majority@k` (~0.808) > `short-3@k` (~0.799) > `short-1@k` (~0.773).
### Interpretation
The chart illustrates a classic trade-off between method complexity/parameterization and performance scaling.
* **`majority@k`** likely represents a simple, baseline ensemble method (e.g., majority voting). Its steady climb suggests it effectively leverages additional samples without saturation, making it the best choice when `k` is large (≥7 in this range).
* **`short-1@k` and `short-3@k`** are labeled "(Ours)", indicating they are the proposed methods from the source document. The numbers 1 and 3 likely refer to a hyperparameter (e.g., sequence length, number of hints).
* `short-1@k` provides a quick boost over the baseline for very small `k` (2-4) but fails to scale, suggesting it may be a lightweight or constrained model that exhausts its useful information early.
* `short-3@k` offers a superior balance. It matches or beats the baseline for `k` up to 6 and maintains strong performance thereafter. This suggests that increasing the "short" parameter from 1 to 3 grants the model better scalability and sustained learning from more data, making it the most robust method across the entire range of sample sizes tested.
The data suggests that for applications where the sample size `k` is small and fixed (e.g., 3-6), the proposed `short-3@k` method is optimal. If `k` can be large and computational cost is not a concern, the simple `majority@k` baseline becomes competitive and eventually superior. The `short-1@k` method appears to have limited utility outside of a very narrow range of small `k`.