## Line Chart: Accuracy vs. Sample Size (k)
### Overview
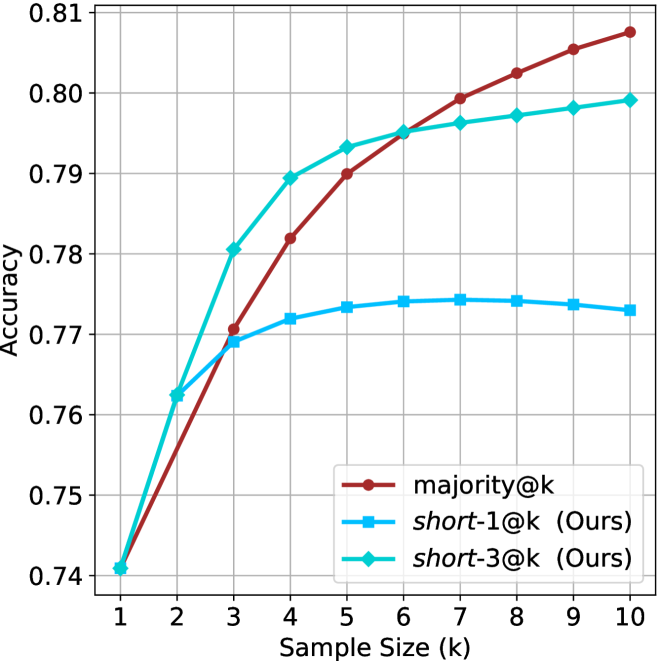
The chart compares the accuracy of three methods—majority@k, short-1@k (Ours), and short-3@k (Ours)—as the sample size (k) increases from 1 to 10. Accuracy is measured on a scale from 0.74 to 0.81.
### Components/Axes
- **X-axis**: Sample Size (k), labeled with integer ticks from 1 to 10.
- **Y-axis**: Accuracy, labeled with increments of 0.01 from 0.74 to 0.81.
- **Legend**: Located in the bottom-right corner, with three entries:
- Red line: majority@k
- Blue line: short-1@k (Ours)
- Green line: short-3@k (Ours)
### Detailed Analysis
1. **majority@k (Red Line)**:
- Starts at 0.74 when k=1.
- Increases steadily, reaching 0.81 at k=10.
- Key data points:
- k=1: 0.74
- k=2: 0.76
- k=3: 0.77
- k=4: 0.78
- k=5: 0.79
- k=6: 0.795
- k=7: 0.80
- k=8: 0.805
- k=9: 0.81
- k=10: 0.81
2. **short-1@k (Blue Line)**:
- Begins at 0.76 when k=1.
- Rises to 0.77 by k=3, then plateaus around 0.77–0.775 for k=4–10.
- Key data points:
- k=1: 0.76
- k=2: 0.77
- k=3: 0.77
- k=4: 0.77
- k=5: 0.77
- k=6: 0.77
- k=7: 0.77
- k=8: 0.77
- k=9: 0.77
- k=10: 0.77
3. **short-3@k (Green Line)**:
- Starts at 0.74 when k=1.
- Sharp increase to 0.79 by k=3, then plateaus around 0.79–0.795 for k=4–10.
- Key data points:
- k=1: 0.74
- k=2: 0.76
- k=3: 0.79
- k=4: 0.79
- k=5: 0.79
- k=6: 0.79
- k=7: 0.79
- k=8: 0.79
- k=9: 0.79
- k=10: 0.79
### Key Observations
- **majority@k** consistently outperforms both short methods across all sample sizes, with the largest gap at k=10 (0.81 vs. 0.77 for short-1@k and 0.79 for short-3@k).
- **short-3@k** surpasses **short-1@k** after k=3, suggesting better performance at larger sample sizes.
- **short-1@k** shows minimal improvement beyond k=3, indicating diminishing returns.
### Interpretation
The chart demonstrates that **majority@k** achieves the highest accuracy as sample size increases, likely due to its reliance on majority voting, which benefits from larger datasets. In contrast, **short-3@k** (Ours) shows a stronger initial improvement compared to **short-1@k** (Ours), suggesting that its design (e.g., using a larger context window or more sophisticated aggregation) is more effective at scaling. However, all methods plateau at higher k values, implying diminishing returns for accuracy gains beyond a certain sample size. This could inform decisions about resource allocation or algorithm selection depending on the trade-off between computational cost and accuracy requirements.