## Program Flow Diagrams
### Overview
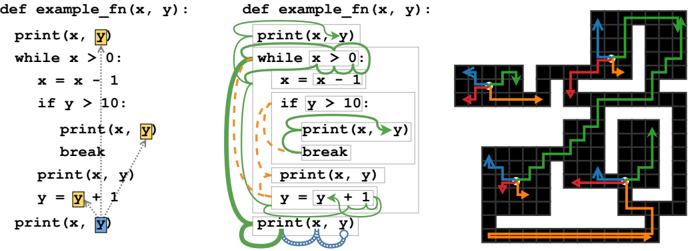
The image presents two diagrams illustrating the flow of a Python function `example_fn(x, y)`. The first diagram uses a simplified, linear representation, while the second provides a more detailed view with loops and conditional branches. The third diagram shows paths through a maze.
### Components/Axes
**Diagram 1 (Left):**
* **Function Definition:** `def example_fn(x, y):`
* **Statements:**
* `print(x, y)`
* `while x > 0:`
* `x = x - 1`
* `if y > 10:`
* `print(x, y)`
* `break`
* `print(x, y)`
* `y = y + 1`
* `print(x, y)`
* **Flow Direction:** Represented by dotted arrows.
* **Variable Values:** Represented by yellow and blue boxes.
**Diagram 2 (Center):**
* **Function Definition:** `def example_fn(x, y):`
* **Statements:** Same as Diagram 1.
* **Flow Direction:** Represented by green, orange, and blue curved arrows indicating loops and conditional execution.
**Diagram 3 (Right):**
* **Maze:** A grid-based maze with black walls and white paths.
* **Paths:** Colored paths (green, red, blue, orange) through the maze, each starting at a white circle and ending with an arrow.
### Detailed Analysis or Content Details
**Diagram 1 (Left):**
* The function starts with `print(x, y)`.
* It enters a `while` loop as long as `x > 0`.
* Inside the loop, `x` is decremented (`x = x - 1`).
* There's a conditional statement `if y > 10:`.
* If the condition is true, `print(x, y)` is executed, and the loop breaks.
* If the condition is false, `print(x, y)` is executed, `y` is incremented (`y = y + 1`), and `print(x, y)` is executed again.
* The flow is generally top-down, with dotted arrows indicating the sequence of execution.
**Diagram 2 (Center):**
* The function starts with `print(x, y)`.
* The green arrow indicates the `while x > 0` loop.
* The orange arrow indicates the `if y > 10` conditional branch.
* The blue arrow indicates the `break` statement.
* The green arrows show the flow returning to the beginning of the `while` loop and the `print(x, y)` statement after incrementing `y`.
**Diagram 3 (Right):**
* The maze consists of black squares representing walls and white paths.
* There are four distinct colored paths:
* **Green:** Starts in the top-right quadrant and winds through the maze to the center.
* **Red:** Starts in the top-right quadrant and goes to the center.
* **Blue:** Starts in the top-left and bottom-left quadrants and goes to the center.
* **Orange:** Starts in the top-left and bottom-left quadrants and goes to the center.
### Key Observations
* Diagram 1 provides a simplified linear view of the code execution.
* Diagram 2 offers a more detailed view, highlighting the looping and conditional branching within the function.
* Diagram 3 shows different paths through a maze, possibly representing different execution paths of the function.
### Interpretation
The diagrams illustrate the control flow of a simple Python function. Diagram 1 shows the basic sequence of operations, while Diagram 2 emphasizes the looping and conditional logic. Diagram 3 is a visual metaphor for the different execution paths the function can take depending on the input values of `x` and `y`. The maze paths could represent different scenarios or test cases for the function. The diagrams are useful for understanding the function's behavior and potential execution paths.