\n
## Diagram: Code Execution Flow Visualization
### Overview
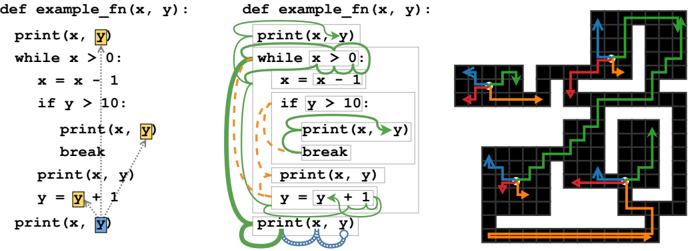
The image presents a visual representation of code execution flow for a Python function `example_fn(x, y)`. It consists of three parts: the original code, a highlighted version showing the execution path, and a grid-based visualization of the function's behavior. The highlighted code uses colored loops and arrows to indicate the order in which statements are executed. The grid visualization shows a path through a maze-like structure, corresponding to the function's execution.
### Components/Axes
The image contains the following components:
* **Original Code:** The Python function definition `def example_fn(x, y):`.
* **Highlighted Code:** A modified version of the code with colored loops and arrows.
* **Grid Visualization:** A grid with black cells representing obstacles and colored arrows indicating the path taken.
* **Color Coding:**
* Green: Represents the initial loop and the first `print(x, y)` statement.
* Orange: Represents the `x = x - 1` and `if y > 10:` statements.
* Red: Represents the `break` statement.
* Yellow: Represents the `y = y + 1` statement.
* Blue: Represents the final `print(x, y)` statement.
* **Arrows:** Indicate the direction of execution flow.
### Detailed Analysis or Content Details
**Original Code:**
```python
def example_fn(x, y):
print(x, y)
while x > 0:
x = x - 1
if y > 10:
print(x, y)
break
print(x, y)
y = y + 1
print(x, y)
```
**Highlighted Code:**
The highlighted code shows the execution path. The green loop encompasses the `while x > 0:` block. Within this loop, the orange path highlights the `x = x - 1` and `if y > 10:` statements. The red path indicates the `break` statement, which exits the loop. The yellow path shows the `y = y + 1` statement. The blue path represents the final `print(x, y)` statement after the loop completes.
**Grid Visualization:**
The grid visualization shows a path through a maze. The path is composed of colored arrows corresponding to the code execution flow.
* The path starts with a green arrow pointing upwards.
* It then turns orange and moves left.
* If the condition `y > 10` is met, the path turns red and exits the maze.
* Otherwise, the path turns yellow and moves downwards.
* The path continues until the loop terminates, and then a blue arrow indicates the final output.
### Key Observations
* The code's execution path is heavily influenced by the `if y > 10:` condition.
* The grid visualization provides a spatial representation of the function's behavior.
* The color coding effectively maps code statements to the execution path.
* The loops and conditional statements create a complex execution flow.
### Interpretation
The diagram illustrates how a simple Python function can have a complex execution path depending on the input values. The grid visualization is a creative way to represent the function's behavior as a maze, where the path taken depends on the conditions encountered during execution. The color coding helps to understand the relationship between the code statements and the execution flow. The diagram suggests that the function's output is sensitive to the initial values of `x` and `y`, and the `if y > 10:` condition plays a crucial role in determining the execution path and the final output. The diagram is a visual aid for understanding the dynamic behavior of the code.