TECHNICAL ASSET FINGERPRINT
1b7c80ebf4dfe79659a9cee7
Click to view fullscreen
Press ESC or click to close
FOUND IN PAPERS
EXPERT: healer-alpha-free VERSION 1
RUNTIME: free/openrouter/healer-alpha
INTEL_VERIFIED
## Technical Diagram: Code Execution Flow Visualization
### Overview
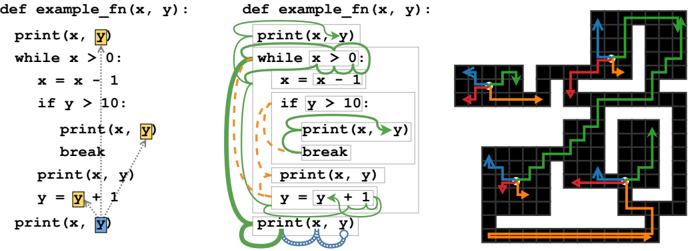
The image is a composite technical diagram illustrating the execution flow of a simple Python function through three interconnected panels. It combines source code with visual annotations and a grid-based state diagram to trace variable changes and control flow. The primary purpose appears to be educational, demonstrating how code execution translates to state changes in memory or a program counter.
### Components/Axes
The image is divided into three distinct vertical panels:
1. **Left Panel (Source Code with Highlights):**
* Contains the Python function definition `def example_fn(x, y):`.
* The code body includes a `while` loop, an `if` condition, `print` statements, and variable assignments.
* Specific instances of the variable `y` are highlighted with colored backgrounds:
* First `print(x, y)`: `y` has a **yellow** background.
* Inside the `if` block: `print(x, y)` has `y` with a **yellow** background.
* Final `print(x, y)`: `y` has a **blue** background.
* Dotted arrows connect the highlighted `y` variables, suggesting a relationship or tracking of that variable's state.
2. **Middle Panel (Source Code with Data Flow Arrows):**
* Contains the identical Python function definition and code as the left panel.
* Overlaid with colored, curved arrows indicating data flow or execution dependencies:
* **Green arrows:** Originate from the function parameters `x` and `y` at the top. They flow to the first `print` statement, loop back around the `while` block, connect to the `if` condition, and point to the final `print` statement. This suggests the green path tracks the primary execution flow or the scope of the parameters.
* **Orange dashed arrows:** Form a loop within the `while` block, connecting the line `x = x - 1` back to the `while x > 0:` condition. This explicitly visualizes the loop iteration.
* **Blue dotted arrows:** Connect the two `print(x, y)` statements inside the `if` block and the final `print(x, y)` statement, possibly indicating a secondary data flow or output sequence.
3. **Right Panel (Grid-Based State Diagram):**
* A black grid (approximately 10x10 cells) representing a state space or memory map.
* Contains multiple colored, arrowed paths that trace routes through the grid. Each path is composed of connected line segments with arrowheads indicating direction.
* **Legend (Top-Left of Grid):** A small key is present but partially obscured. It shows:
* A **blue** arrow pointing up.
* A **red** arrow pointing left.
* An **orange** arrow pointing right.
* A **green** arrow pointing down.
* **Paths within the grid:**
* A **green** path starts near the top-center, moves down, then right, then down again in a stepped pattern.
* A **red** path starts on the left, moves right, then down, then left.
* An **orange** path starts at the bottom-left, moves right along the bottom edge, then up the right side.
* A **blue** path is visible in the top-left corner, moving up and then right.
* The paths intersect and overlap at various points, creating a complex network that likely maps to the execution steps or variable states from the code panels.
### Detailed Analysis
**Code Transcription (Left & Middle Panels):**
```python
def example_fn(x, y):
print(x, y)
while x > 0:
x = x - 1
if y > 10:
print(x, y)
break
print(x, y)
y = y + 1
print(x, y)
```
**Grid Diagram Spatial Analysis:**
* The **green path** is the most prominent, starting at grid coordinates roughly (column 5, row 1) from the top-left. It proceeds: Down 2 cells, Right 1 cell, Down 2 cells, Right 1 cell, Down 2 cells. This creates a diagonal staircase pattern descending from the top-center to the bottom-center.
* The **red path** begins at approximately (column 1, row 3). It moves: Right 3 cells, Down 2 cells, Left 3 cells. This forms a rectangular loop in the left-center region.
* The **orange path** starts at the bottom-left corner (column 1, row 9). It moves: Right 8 cells along the bottom row, then Up 8 cells along the rightmost column. This traces the bottom and right borders of the grid.
* The **blue path** is confined to the top-left quadrant, starting at (column 1, row 1) and moving Up (off the grid?) and Right 2 cells.
### Key Observations
1. **Direct Correlation:** The colored arrows in the middle code panel (green, orange, blue) correspond directly to the colored paths in the right grid diagram. This establishes a clear visual mapping between code constructs and the state diagram.
2. **Loop Visualization:** The orange dashed arrow in the code, which loops around the `while` block, corresponds to the orange path that makes a large, encompassing loop around the grid's perimeter. This may represent the overall iteration cycle of the `while` loop.
3. **Variable Tracking:** The highlighting of the variable `y` in the left panel (yellow and blue) suggests a focus on tracking its value changes throughout execution, which may be represented by one of the paths (possibly the green one, as it is the most complex and central).
4. **Non-Literal Mapping:** The grid paths do not appear to be a literal, step-by-step trace of the code's line execution. Instead, they seem to be an abstract, symbolic representation of the program's state space, control flow, or variable relationships.
### Interpretation
This diagram is a pedagogical tool for visualizing program execution. It moves beyond simple line-by-line stepping to show execution as a journey through a defined state space (the grid).
* **What it demonstrates:** It illustrates how a linear piece of code with loops and conditionals creates a non-linear execution path. The grid represents all possible states the program can be in, and the colored paths show the specific trajectory taken for a given input (`x`, `y`).
* **Relationship between elements:** The left panel highlights *what* to track (variable `y`). The middle panel shows *how* data and control flow through the code's structure. The right panel maps that flow onto an abstract *space* of possibilities. The legend in the grid is crucial for decoding which code construct (e.g., loop, conditional branch, parameter flow) each colored path represents.
* **Underlying Concept:** This is likely an example of **control flow analysis** or **program visualization**. The grid could be a simplified model of a **control flow graph (CFG)** or a **state transition diagram**. The orange path's perimeter loop strongly suggests it represents the `while` loop's iterative nature. The green path's stepped descent might represent the decrement of `x` (`x = x - 1`) with each iteration. The diagram emphasizes that program execution is not just a sequence of lines but a dynamic process with history and state.
DECODING INTELLIGENCE...