## Code Flowchart: Execution Path Visualization
### Overview
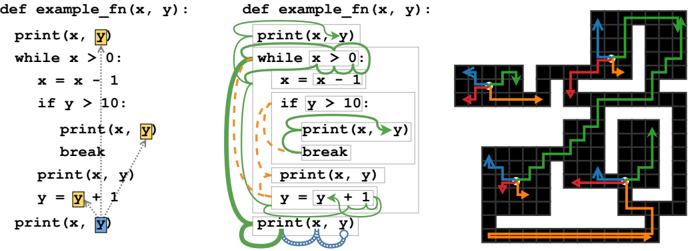
The image contains three components:
1. **Left**: A Python function `example_fn(x, y)` with annotations (arrows, colors) indicating execution flow.
2. **Center**: A modified version of the same function with additional annotations (green circles, orange dashed lines).
3. **Right**: A flowchart visualizing the control flow using colored arrows (green, red, blue, orange).
### Components/Axes
#### Left Code Snippet
- **Function Definition**: `def example_fn(x, y):`
- **Print Statements**:
- `print(x, y)` (annotated with yellow and blue boxes).
- `print(x, y)` inside `while` loop (yellow box).
- `print(x, y)` after `break` (blue box).
- **Loop Structure**:
- `while x > 0:` (annotated with green arrow).
- `x = x - 1` (dashed orange line).
- **Conditional Break**:
- `if y > 10:` (green arrow).
- `break` (red arrow).
- **Post-Loop Print**: `print(x, y)` (blue box).
#### Center Code Snippet
- **Annotations**:
- Green circles around `print(x, y)` and `while x > 0:`.
- Orange dashed lines connecting `print(x, y)` to `break`.
- Blue wavy line connecting `y = y + 1` to final `print(x, y)`.
#### Right Flowchart
- **Nodes**:
- `print(x, y)` (start node, green arrow).
- `while x > 0:` (loop condition, green arrow).
- `x = x - 1` (dashed orange line).
- `if y > 10:` (conditional, green arrow).
- `break` (red arrow).
- `y = y + 1` (blue arrow).
- **Edges**:
- Green arrows for primary flow.
- Red arrow for `break`.
- Blue arrow for post-loop execution.
- Orange dashed lines for conditional paths.
### Detailed Analysis
#### Left Code Snippet
- **Execution Flow**:
1. Initial `print(x, y)` (yellow box).
2. Enter `while x > 0:` loop (green arrow).
3. Decrement `x` by 1 (dashed orange line).
4. Check `if y > 10:` (green arrow).
- If true: Execute `break` (red arrow).
- If false: Continue loop.
5. After loop, execute final `print(x, y)` (blue box).
6. Increment `y` by 1 (`y = y + 1`).
#### Center Code Snippet
- **Annotations**:
- Green circles emphasize repeated `print(x, y)` calls.
- Orange dashed lines highlight the conditional `break` path.
- Blue wavy line indicates post-loop execution.
#### Right Flowchart
- **Color-Coded Paths**:
- **Green**: Primary loop iterations (`while x > 0`).
- **Red**: `break` termination.
- **Blue**: Post-loop execution.
- **Orange**: Conditional `if y > 10` path.
### Key Observations
1. **Loop Termination**: The loop exits either when `x ≤ 0` or `y > 10`.
2. **Variable Updates**: `x` decrements by 1 per iteration; `y` increments by 1 after the loop.
3. **Print Statements**:
- Initial and final `print(x, y)` capture state before/after loop.
- Intermediate `print(x, y)` inside the loop (annotated with yellow/blue boxes).
### Interpretation
The flowchart and annotations illustrate a function that:
1. Prints initial `(x, y)` values.
2. Iterates while `x > 0`, decrementing `x` each iteration.
3. Breaks early if `y > 10`, skipping remaining iterations.
4. Prints final `(x, y)` after loop termination.
5. Increments `y` post-loop, suggesting a secondary effect outside the loop.
The annotations and flowchart emphasize **control flow dependencies**:
- The `break` condition (`y > 10`) overrides the `x > 0` loop condition.
- The final `print(x, y)` occurs regardless of loop termination reason.
- The post-loop `y = y + 1` implies a side effect independent of the loop's logic.
This visualization aids in understanding how variable updates and conditional breaks interact in nested control structures.