# Technical Document Extraction: HumanEval Pass@1 Accuracy Chart
## Chart Title
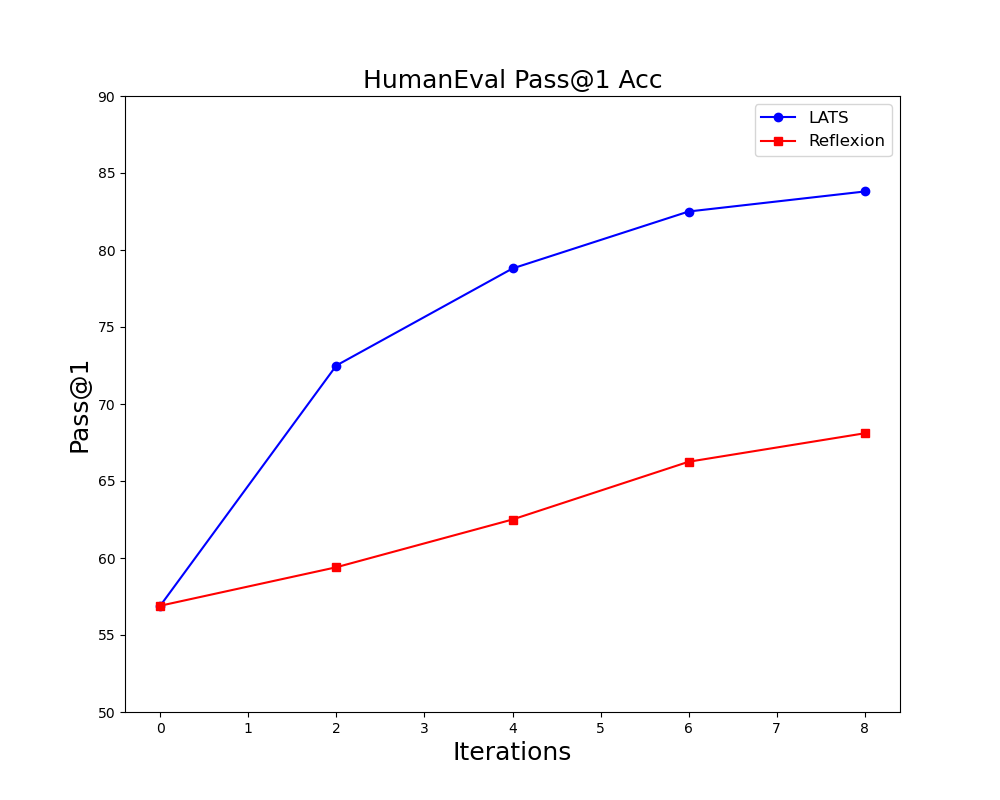
- **Title**: HumanEval Pass@1 Acc
## Axis Labels
- **X-Axis**: Iterations (0 to 8, integer increments)
- **Y-Axis**: Pass@1 (50 to 90, integer increments of 5)
## Legend
- **Blue Line**: LATS
- **Red Line**: Reflexion
## Data Points
### LATS (Blue Line)
- Iteration 0: 57
- Iteration 2: 72
- Iteration 4: 79
- Iteration 6: 82
- Iteration 8: 84
### Reflexion (Red Line)
- Iteration 0: 57
- Iteration 2: 59
- Iteration 4: 62
- Iteration 6: 66
- Iteration 8: 68
## Key Trends
1. **LATS** demonstrates a **steep upward trajectory**, increasing from 57 to 84 across 8 iterations (+27 points).
2. **Reflexion** shows a **gradual linear increase**, rising from 57 to 68 across 8 iterations (+11 points).
3. **Divergence**: LATS consistently outperforms Reflexion by 10–16 points at all iterations after the initial value.
## Observations
- Both methods start at identical baseline accuracy (57) at iteration 0.
- LATS achieves **84% Pass@1 accuracy** by iteration 8, while Reflexion reaches **68%**.
- No plateau or decline observed in either method; both exhibit monotonic improvement.