## Line Graphs: AvER^ITF(c) vs. Amount of Collapse (c)
### Overview
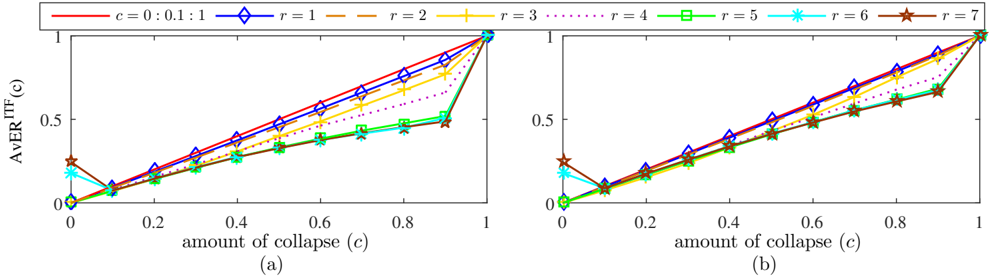
Two line graphs (a) and (b) depict the relationship between the average error rate (AvER^ITF(c)) and the amount of collapse (c), ranging from 0 to 1. Both graphs share identical axes and legends but differ in line styles and markers for data series.
### Components/Axes
- **Y-axis**: Labeled "AvER^ITF(c)" with values from 0 to 1.
- **X-axis**: Labeled "amount of collapse (c)" with values from 0 to 1.
- **Legends**:
- **Graph (a)**:
- Red solid line with diamond markers: `c = 0 : 0.1 : 1`
- Blue diamond markers: `r = 1`
- Brown dashed line: `r = 2`
- Yellow cross markers: `r = 3`
- Purple dotted line: `r = 4`
- Green square markers: `r = 5`
- Cyan star markers: `r = 6`
- Brown star markers: `r = 7`
- **Graph (b)**:
- Same legend entries as (a), but line styles and markers vary slightly (e.g., `r = 4` uses a dotted line with stars instead of squares).
### Detailed Analysis
- **Graph (a)**:
- All lines start at (0, 0) and end at (1, 1), but slopes vary.
- `c = 0 : 0.1 : 1` (red solid line) is linear, while others curve upward.
- Higher `r` values (e.g., `r = 7`) show steeper slopes.
- Markers align with legend entries (e.g., diamonds for `r = 1`, stars for `r = 7`).
- **Graph (b)**:
- Similar trends to (a), but line styles differ (e.g., `r = 4` uses a dotted line with stars).
- `c = 0 : 0.1 : 1` remains linear, while other lines curve upward.
- Markers and colors match legend entries (e.g., green squares for `r = 5`).
### Key Observations
1. **Linear Baseline**: The `c = 0 : 0.1 : 1` line (red solid) acts as a reference, showing a constant rate of increase.
2. **Nonlinear Trends**: Lines for `r > 1` exhibit nonlinear growth, with steeper slopes for higher `r` values.
3. **Consistent Endpoints**: All lines terminate at (1, 1), suggesting a universal upper bound for AvER^ITF(c) at maximum collapse.
4. **Marker Consistency**: Each data series uses distinct markers (e.g., diamonds, stars) to differentiate parameters.
### Interpretation
- **System Behavior**: The graphs likely model how AvER^ITF(c) scales with collapse under varying conditions (e.g., `r` and `c` ratios). Higher `r` values may represent scenarios with greater sensitivity to collapse.
- **Reference Scenario**: The linear `c = 0 : 0.1 : 1` line provides a baseline for comparing nonlinear trends.
- **Design Intent**: Differentiated line styles and markers ensure clarity in distinguishing parameters, critical for technical analysis.
No textual content in other languages is present. All data points and trends are visually consistent with legend labels.