# Technical Document Extraction: Heatmap Analysis of UNet Variants
## Image Description
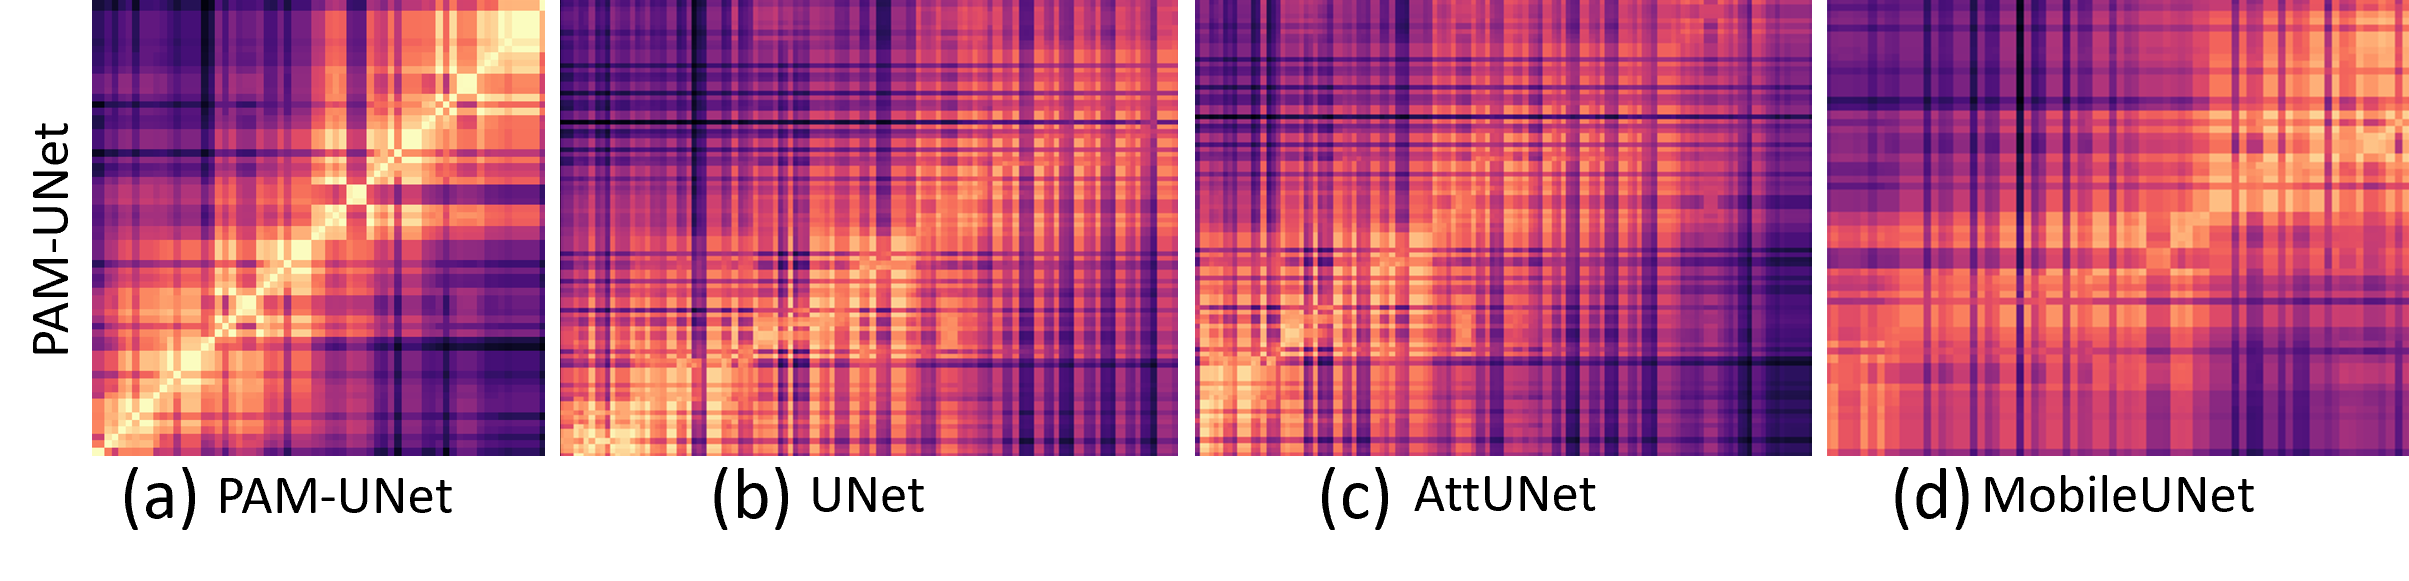
The image presents four comparative heatmaps labeled **(a) PAM-UNet**, **(b) UNet**, **(c) AttUNet**, and **(d) MobileUNet**. Each heatmap visualizes a matrix of values using a color gradient from **purple (low values)** to **yellow (high values)**. No explicit legend or colorbar is provided to quantify the values.
---
### **Key Labels and Axis Titles**
1. **Y-Axis**: Labeled "PAM-UNet" across all heatmaps.
2. **X-Axis**: Unlabeled in all heatmaps.
3. **Heatmap Labels**:
- (a) PAM-UNet
- (b) UNet
- (c) AttUNet
- (d) MobileUNet
---
### **Heatmap Analysis**
#### **(a) PAM-UNet**
- **Pattern**: Strong diagonal dominance with high values (yellow) along the diagonal from top-left to bottom-right.
- **Trend**: Values decrease symmetrically away from the diagonal, forming a gradient.
- **Spatial Grounding**: Highest values concentrated along the diagonal axis.
#### **(b) UNet**
- **Pattern**: Uniform distribution with no clear diagonal trend.
- **Trend**: Values are relatively consistent across the matrix, with occasional localized peaks (yellow regions).
- **Spatial Grounding**: No dominant axis; values are scattered.
#### **(c) AttUNet**
- **Pattern**: Similar to UNet but with slightly more pronounced vertical/horizontal striations.
- **Trend**: Values cluster in horizontal bands, suggesting feature-group dependencies.
- **Spatial Grounding**: Vertical/horizontal groupings dominate.
#### **(d) MobileUNet**
- **Pattern**: Diagonal trend similar to PAM-UNet but with reduced intensity.
- **Trend**: Diagonal values are high (yellow), but off-diagonal regions show more variability than PAM-UNet.
- **Spatial Grounding**: Diagonal remains dominant but less pronounced than in PAM-UNet.
---
### **Observations**
1. **Diagonal Dominance**: PAM-UNet and MobileUNet exhibit diagonal patterns, likely indicating self-similarity or identity preservation in feature mappings.
2. **Uniformity**: UNet and AttUNet lack strong diagonal trends, suggesting more distributed feature interactions.
3. **Color Consistency**: All heatmaps use the same purple-to-yellow gradient, but no numerical scale is provided to quantify differences.
---
### **Limitations**
- No explicit legend or colorbar to interpret absolute value ranges.
- Unlabeled x-axis prevents identification of specific categories or sub-categories.
- No textual data or tables present in the image.
---
### **Conclusion**
The heatmaps compare feature interaction patterns across four UNet variants. PAM-UNet and MobileUNet show stronger diagonal correlations, while UNet and AttUNet exhibit more uniform or grouped distributions. Further analysis with quantitative metrics (e.g., correlation matrices) is required for precise comparisons.