## Scatter Plot: Alpha-Loss Correlation
### Overview
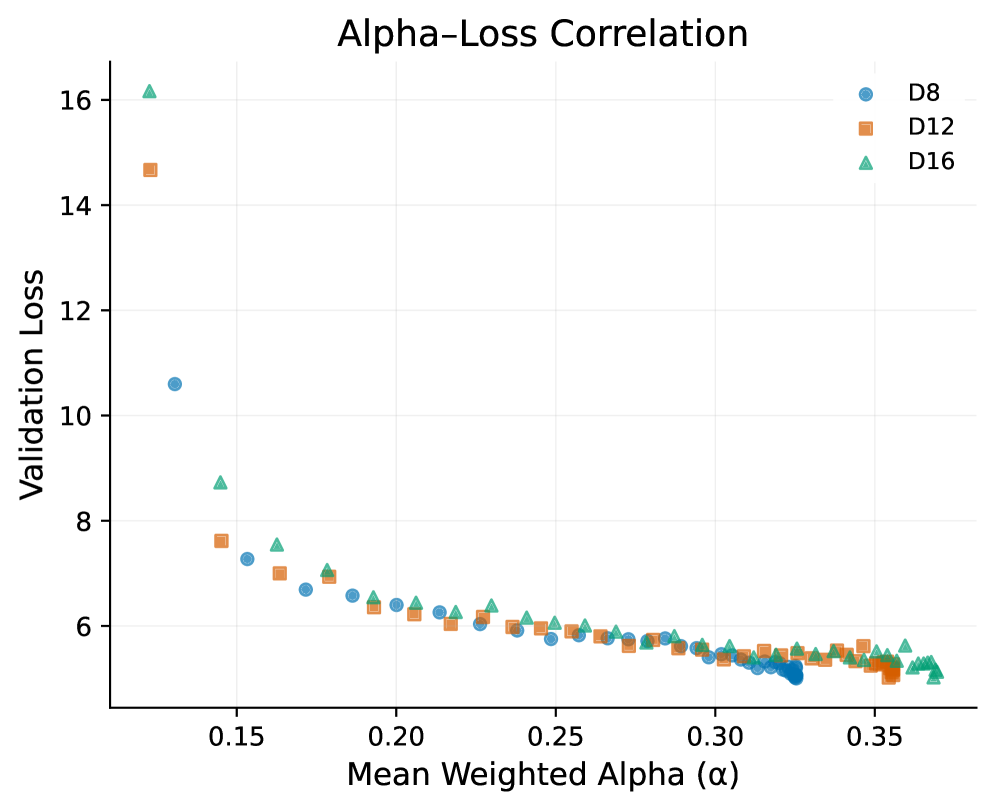
The image is a scatter plot titled "Alpha-Loss Correlation," visualizing the relationship between **Mean Weighted Alpha (α)** and **Validation Loss** across three datasets (D8, D12, D16). The x-axis represents Mean Weighted Alpha (ranging from 0.1 to 0.35), and the y-axis represents Validation Loss (ranging from 5 to 16). Three distinct data series are plotted using different markers and colors: D8 (blue circles), D12 (orange squares), and D16 (green triangles). The legend is positioned in the top-right corner.
---
### Components/Axes
- **X-axis**: "Mean Weighted Alpha (α)" with ticks at 0.1, 0.15, 0.2, 0.25, 0.3, 0.35.
- **Y-axis**: "Validation Loss" with ticks at 6, 8, 10, 12, 14, 16.
- **Legend**: Located in the top-right corner, mapping:
- Blue circles → D8
- Orange squares → D12
- Green triangles → D16
---
### Detailed Analysis
#### Data Series Trends
1. **D8 (Blue Circles)**:
- Starts at approximately **(0.15, 10.5)**.
- Decreases steadily to **(0.33, 5.2)**.
- Shows a consistent downward trend with minimal scatter.
2. **D12 (Orange Squares)**:
- Begins at **(0.12, 14.8)**.
- Declines to **(0.35, 5.0)**.
- Exhibits a steeper initial drop compared to D8 and D16.
3. **D16 (Green Triangles)**:
- Starts at **(0.1, 16.2)**.
- Reduces to **(0.35, 5.1)**.
- Follows a gradual decline with slight fluctuations.
#### Key Data Points
- **D8**:
- (0.15, 10.5), (0.2, 8.0), (0.25, 6.2), (0.3, 5.5), (0.33, 5.2).
- **D12**:
- (0.12, 14.8), (0.18, 7.0), (0.22, 6.0), (0.28, 5.8), (0.35, 5.0).
- **D16**:
- (0.1, 16.2), (0.15, 8.5), (0.2, 6.5), (0.25, 6.0), (0.3, 5.7), (0.35, 5.1).
---
### Key Observations
1. **Downward Trend**: All three datasets show a clear inverse relationship between Mean Weighted Alpha and Validation Loss. Higher α values correspond to lower validation loss.
2. **Convergence**: By α = 0.3, all datasets cluster tightly between 5.0 and 6.0, suggesting diminishing returns or stabilization of performance at higher α values.
3. **Initial Disparity**: D16 begins with the highest validation loss (16.2 at α = 0.1), while D8 starts lowest (10.5 at α = 0.15). D12 falls in between (14.8 at α = 0.12).
4. **Outliers**: No significant outliers; all points align with their respective trends.
---
### Interpretation
The data suggests that increasing the Mean Weighted Alpha improves model performance (lower validation loss) across all datasets. However, the initial performance disparity (D16 > D12 > D8) indicates inherent differences in dataset complexity or noise. The convergence at higher α values implies that the model's sensitivity to α diminishes as α increases, potentially due to regularization effects or saturation of the model's capacity. This trend could inform hyperparameter tuning strategies, prioritizing higher α values for datasets with initially poor performance (e.g., D16). The uniformity in final performance (α ≥ 0.3) suggests that further increases in α may not yield significant gains, highlighting a trade-off between computational cost and marginal improvements.