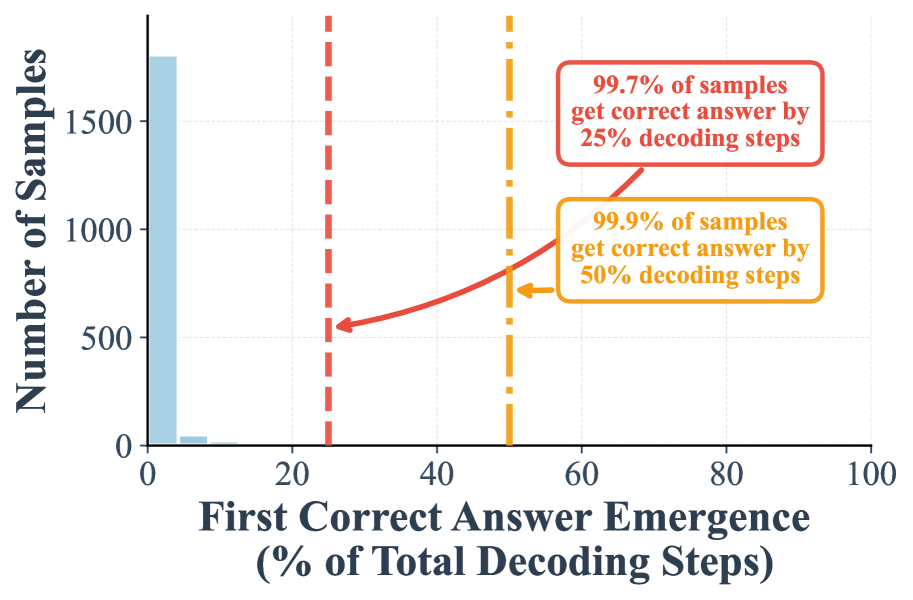
## Histogram: First Correct Answer Emergence Timing
### Overview
This image is a histogram chart illustrating the distribution of when a model first produces a correct answer during its decoding process, measured as a percentage of the total decoding steps. The chart includes two key annotations highlighting the cumulative percentage of samples that have achieved a correct answer by specific decoding milestones.
### Components/Axes
* **Chart Type:** Histogram (bar chart showing frequency distribution).
* **X-Axis (Horizontal):**
* **Label:** "First Correct Answer Emergence (% of Total Decoding Steps)"
* **Scale:** Linear scale from 0 to 100.
* **Major Tick Marks:** 0, 20, 40, 60, 80, 100.
* **Y-Axis (Vertical):**
* **Label:** "Number of Samples"
* **Scale:** Linear scale from 0 to over 1500.
* **Major Tick Marks:** 0, 500, 1000, 1500.
* **Data Series:** A single series represented by light blue bars.
* **Annotations:**
1. **Red Dashed Vertical Line:** Positioned at approximately 25% on the x-axis.
* **Associated Text Box (Red Border, Top-Right):** "99.7% of samples get correct answer by 25% decoding steps"
* A red arrow points from this text box to the red dashed line.
2. **Orange Dashed Vertical Line:** Positioned at approximately 50% on the x-axis.
* **Associated Text Box (Orange Border, Below Red Box):** "99.9% of samples get correct answer by 50% decoding steps"
* An orange arrow points from this text box to the orange dashed line.
### Detailed Analysis
* **Data Distribution Trend:** The histogram shows an extreme left-skewed distribution. The vast majority of samples achieve their first correct answer at the very beginning of the decoding process.
* **Bar Values (Approximate):**
* The first bar, centered near 0-2% on the x-axis, is the tallest, reaching a height of approximately 1750 on the y-axis (Number of Samples).
* A second, very small bar is visible between approximately 5-10% on the x-axis. Its height is very low, estimated to be around 50-100 samples.
* No other bars are visible across the rest of the x-axis (from ~10% to 100%).
* **Annotation Data Points:**
* The red annotation indicates that by the 25% decoding step mark, 99.7% of all samples have already produced their first correct answer.
* The orange annotation indicates that by the 50% decoding step mark, 99.9% of all samples have produced their first correct answer. This implies only 0.1% of samples require more than half the decoding steps to first become correct.
### Key Observations
1. **Extreme Early Success:** The model's performance is heavily concentrated at the very start of the sequence. The overwhelming majority of correct answers emerge within the first few percent of decoding steps.
2. **Near-Complete Saturation by 25%:** The 99.7% milestone at 25% steps is a critical observation, showing that the process is highly efficient and rarely needs to proceed far to find a correct solution.
3. **Negligible Late Bloomers:** The difference between 99.7% at 25% steps and 99.9% at 50% steps is only 0.2%, indicating an extremely small fraction of samples are "slow starters."
4. **Visual Confirmation:** The physical absence of any visible bars beyond the 10% mark on the x-axis visually corroborates the high percentages stated in the annotations.
### Interpretation
This histogram demonstrates exceptional efficiency in the model's decoding or generation process for the given task. The data suggests that the model's mechanism for arriving at a correct answer is highly effective and operates decisively at the outset.
* **Performance Implication:** The model does not typically require extensive "search" or many iterative steps to find a correct solution. Success is almost immediate.
* **Resource Allocation:** From a systems perspective, this could imply that computational resources (like decoding steps) could be safely capped at a much lower percentage (e.g., 25-30%) without sacrificing accuracy for the vast majority of cases, potentially leading to significant efficiency gains.
* **Underlying Mechanism:** The pattern is indicative of a model that either has very strong initial priors or confidence, or whose correct reasoning paths are readily accessible early in its generation sequence. The near-total lack of a "long tail" in the distribution is a notable and positive characteristic for reliability and predictability.