## Line Chart: First Correct Answer Emergence vs. Number of Samples
### Overview
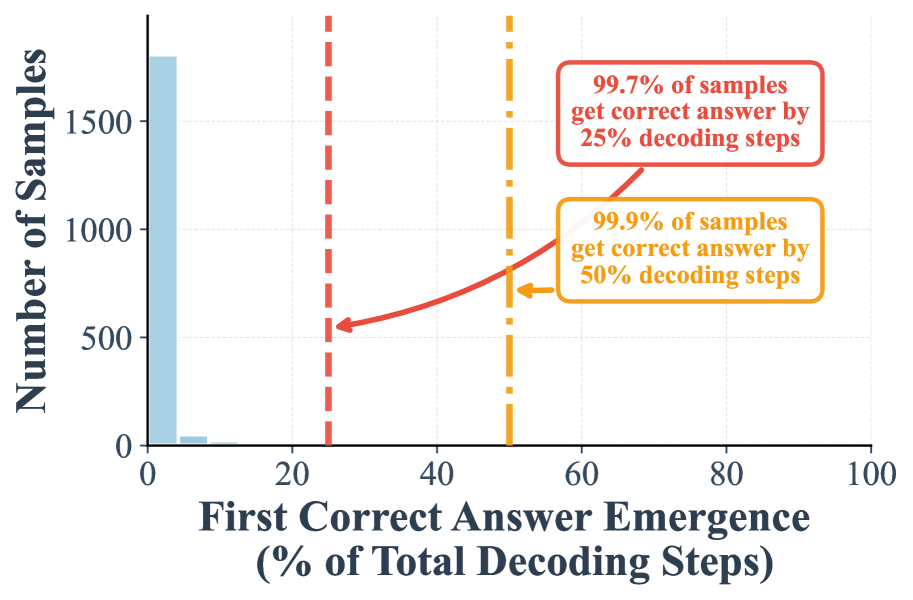
The chart illustrates the relationship between the percentage of decoding steps required to reach the first correct answer and the number of samples achieving that outcome. Two data series (red and orange lines) show cumulative sample counts as decoding steps increase from 0% to 100%.
### Components/Axes
- **X-axis**: "First Correct Answer Emergence (% of Total Decoding Steps)" (0–100% range, linear scale).
- **Y-axis**: "Number of Samples" (0–1500, linear scale).
- **Legend**: Located on the right, with:
- **Red line**: "99.7% of samples get correct answer by 25% decoding steps".
- **Orange line**: "99.9% of samples get correct answer by 50% decoding steps".
- **Annotations**:
- Red dashed vertical line at 25% decoding steps.
- Orange dashed vertical line at 50% decoding steps.
- Arrows linking annotations to data points.
### Detailed Analysis
1. **Red Line (99.7% at 25%)**:
- Starts at **25% decoding steps** with **~500 samples**.
- Rises to **~1000 samples** at **50% decoding steps**.
- Slope: Steep upward trend between 25% and 50%.
2. **Orange Line (99.9% at 50%)**:
- Begins at **50% decoding steps** with **~1000 samples**.
- Increases to **~1500 samples** at **100% decoding steps**.
- Slope: Gradual upward trend after 50%.
3. **Key Data Points**:
- At **0% decoding steps**: ~1500 samples (y-intercept, no decoding steps required).
- At **25% decoding steps**: Red line intersects at ~500 samples.
- At **50% decoding steps**: Orange line intersects at ~1000 samples.
- At **100% decoding steps**: Orange line reaches ~1500 samples.
### Key Observations
- **Rapid Initial Coverage**: 99.7% of samples achieve correctness by 25% decoding steps, suggesting high efficiency in early decoding.
- **Diminishing Returns**: The orange line shows slower growth after 50%, indicating most samples are resolved by mid-decoding steps.
- **Saturation**: By 100% decoding steps, all samples (1500) are resolved, but the orange line plateaus near this value.
### Interpretation
The data demonstrates that **early decoding steps (≤50%) resolve the majority of samples**, with 99.7% correctness achieved by 25% steps. The red line’s steep rise between 25% and 50% implies a critical threshold where most samples are resolved. The orange line’s gradual increase after 50% suggests diminishing returns, as only 0.2% additional samples are resolved by extending decoding steps to 100%. This highlights the efficiency of the decoding process, where most errors are corrected early, and further steps have minimal impact. The annotations emphasize the model’s robustness, as even limited decoding steps yield near-complete correctness.