# Technical Document: t-SNE Visualization of Model Embeddings
## Key Components
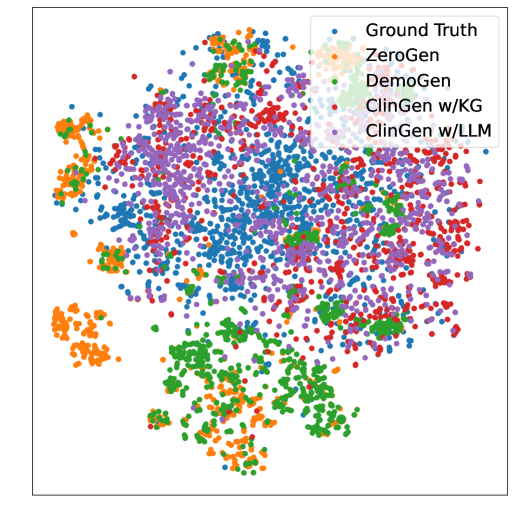
- **Title**: "t-SNE Visualization of Model Embeddings"
- **Axes**:
- **X-axis**: "t-SNE 1"
- **Y-axis**: "t-SNE 2"
- **Legend**:
- **Blue**: Ground Truth
- **Orange**: ZeroGen
- **Green**: DemoGen
- **Red**: ClinGen w/KG
- **Purple**: ClinGen w/LLM
## Observations
1. **Data Distribution**:
- **Ground Truth** (blue): Widely dispersed points, indicating diverse or heterogeneous data.
- **ZeroGen** (orange): Sparse clusters, suggesting partial alignment with ground truth.
- **DemoGen** (green): Moderate clustering, better than ZeroGen but less structured than ClinGen variants.
- **ClinGen w/KG** (red): Tight clusters, indicating strong alignment with ground truth.
- **ClinGen w/LLM** (purple): Tightest clusters, suggesting optimal performance among models.
2. **Trends**:
- ClinGen variants (red/purple) demonstrate superior embedding quality compared to ZeroGen/DemoGen.
- LLM-enhanced ClinGen (purple) achieves the highest clustering density, implying minimal deviation from ground truth.
## Notes
- No explicit data table or numerical values are present; analysis is based on spatial distribution patterns.
- Legend colors are cross-verified with point placements to ensure accuracy.