TECHNICAL ASSET FINGERPRINT
1badcd527816f1c0c0902fea
Click to view fullscreen
Press ESC or click to close
FOUND IN PAPERS
EXPERT: gemini-2.0-flash VERSION 1
RUNTIME: nugit/gemini/gemini-2.0-flash
INTEL_VERIFIED
## Composite Image Analysis: Movie Industry Data
### Overview
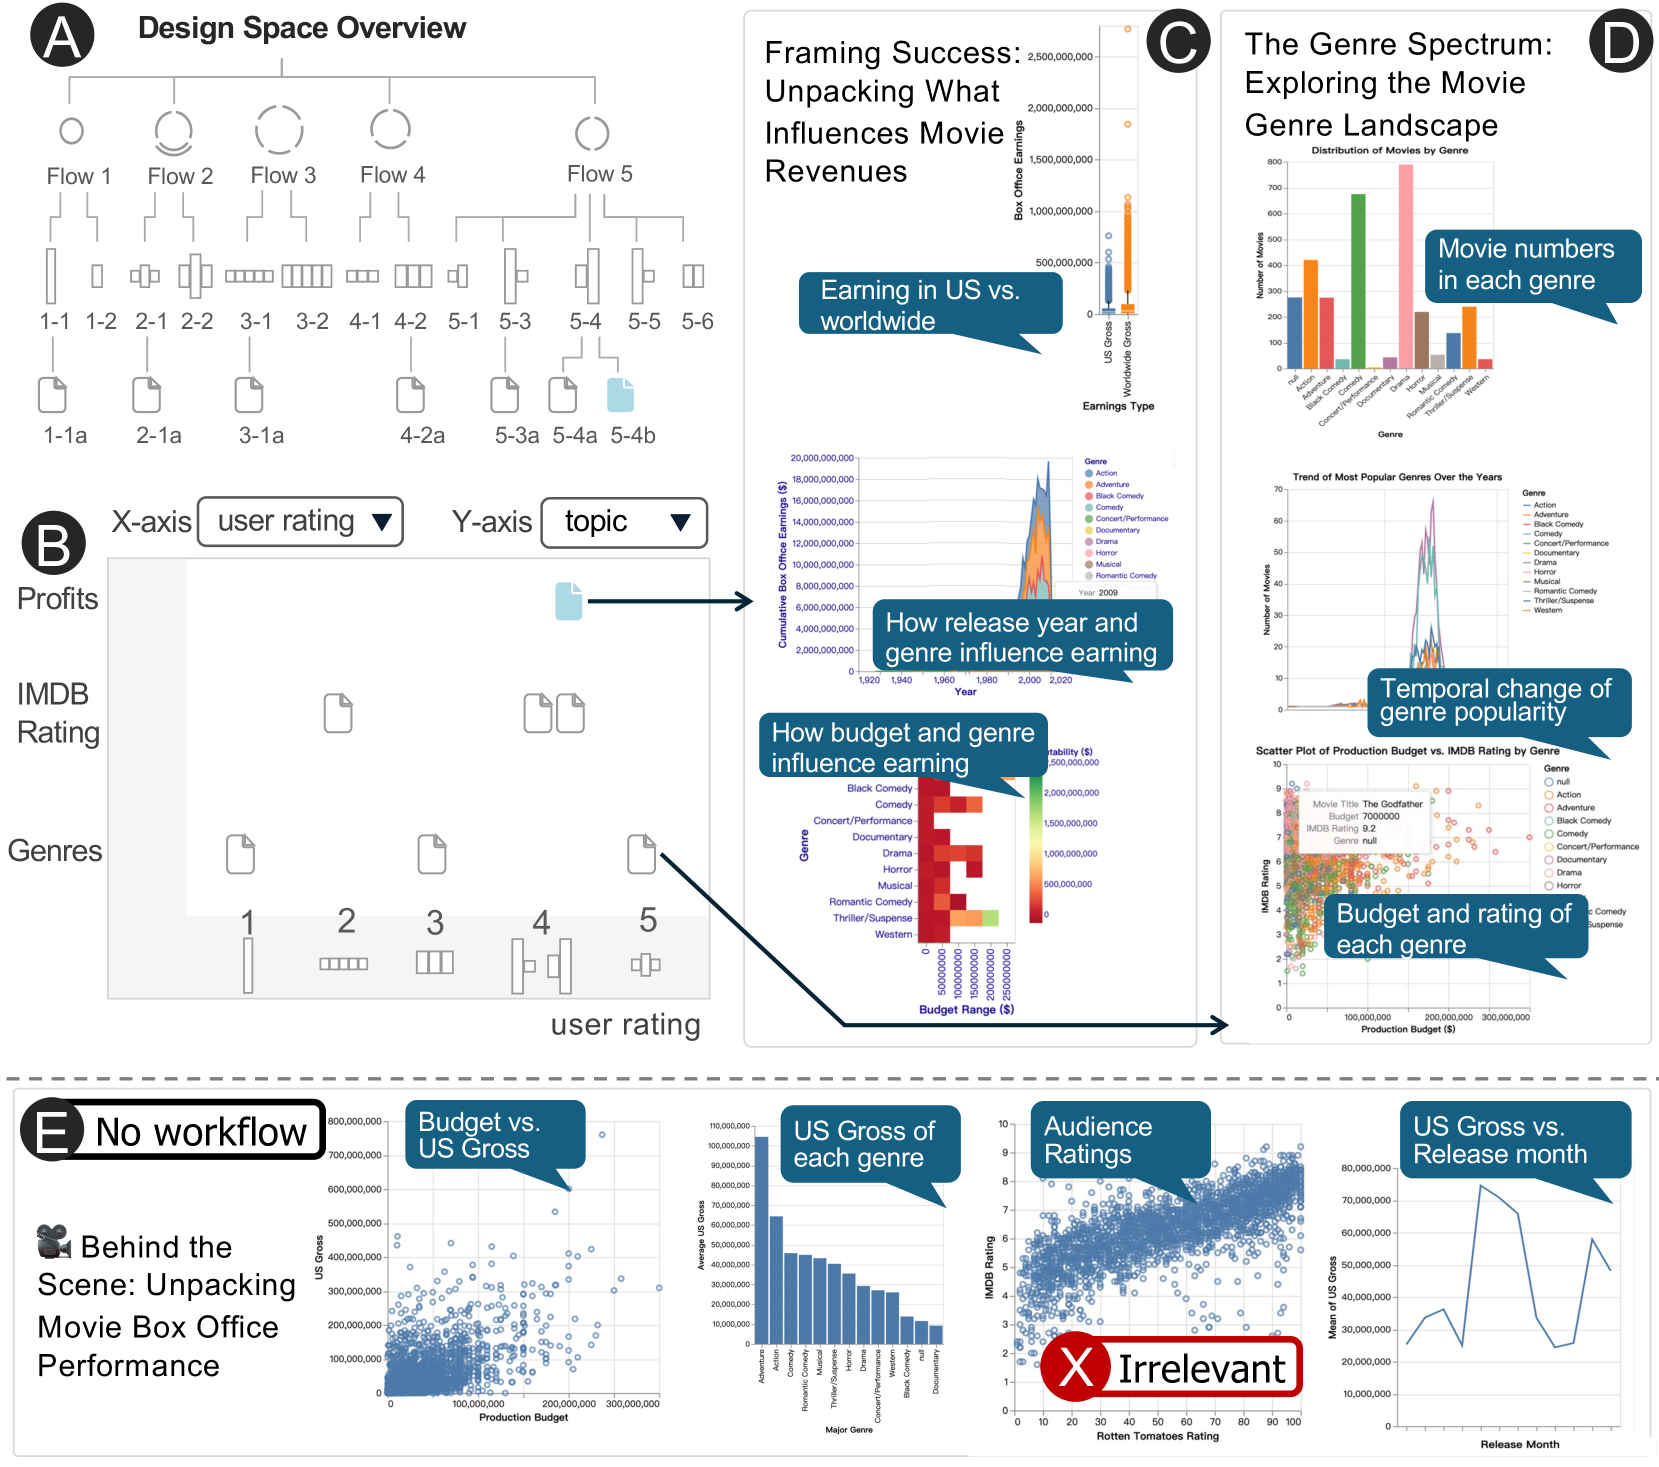
The image presents a collection of charts and diagrams exploring various aspects of the movie industry, including design space overview, factors influencing movie revenues, genre analysis, and budget vs. gross relationships. The image is divided into sections labeled A through E, each focusing on a different facet of the industry.
### Components/Axes
**Section A: Design Space Overview**
* **Type:** Flowchart
* **Description:** A hierarchical diagram illustrating a design space with five main flows (Flow 1 to Flow 5). Each flow branches into sub-elements, represented by numbered boxes (e.g., 1-1, 1-2, 2-1, etc.). Some of these sub-elements further branch into lower-level elements (e.g., 1-1a, 2-1a, 3-1a, etc.).
**Section B: User Rating vs. Topic**
* **Type:** Scatter Plot Conceptual Layout
* **X-axis:** User Rating (selectable dropdown)
* **Y-axis:** Topic (selectable dropdown)
* **Description:** A conceptual layout for a scatter plot, with axes labeled "user rating" and "topic." The plot area contains placeholders for data points, suggesting a visualization of how user ratings relate to different topics.
**Section C: Framing Success: Unpacking What Influences Movie Revenues**
* **Title:** Framing Success: Unpacking What Influences Movie Revenues
* **Sub-sections:**
* Earning in US vs. worldwide
* How release year and genre influence earning
* How budget and genre influence earning
* **Earning in US vs. worldwide**
* **Type:** Scatter Plot
* **X-axis:** Earnings Type (US Gross, Worldwide Gross)
* **Y-axis:** Box Office Earnings
* **Scale:** 0 to 2,500,000,000
* **Description:** A scatter plot comparing US gross earnings against worldwide gross earnings.
* **How release year and genre influence earning**
* **Type:** Area Chart
* **X-axis:** Year (1920 to 2020)
* **Y-axis:** Cumulative Box Office Earnings ($) (0 to 20,000,000,000)
* **Legend:**
* Action (Blue)
* Adventure (Orange)
* Black Comedy (Gray)
* Comedy (Yellow)
* Concert/Performance (Green)
* Documentary (Teal)
* Drama (Purple)
* Horror (Brown)
* Musical (Pink)
* Romantic Comedy (Light Blue)
* Year 2009 (Red)
* **Description:** An area chart showing how cumulative box office earnings vary by genre over time.
* **How budget and genre influence earning**
* **Type:** Heatmap
* **X-axis:** Budget Range ($) (0 to 250,000,000)
* **Y-axis:** Genre
* **Genres:** Black Comedy, Comedy, Concert/Performance, Documentary, Drama, Horror, Musical, Romantic Comedy, Thriller/Suspense, Western
* **Color Scale:** Represents profitability ($) from 0 to 2,500,000,000 (Green to Red)
* **Description:** A heatmap illustrating the relationship between budget range and genre profitability.
**Section D: The Genre Spectrum: Exploring the Movie Genre Landscape**
* **Title:** The Genre Spectrum: Exploring the Movie Genre Landscape
* **Sub-sections:**
* Distribution of Movies by Genre
* Trend of Most Popular Genres Over the Years
* Scatter Plot of Production Budget vs. IMDB Rating by Genre
* **Distribution of Movies by Genre**
* **Type:** Bar Chart
* **X-axis:** Genre
* **Y-axis:** Number of Movies (0 to 800)
* **Genres:** Action, Adventure, Black Comedy, Comedy, Concert/Performance, Documentary, Drama, Horror, Musical, Romantic Comedy, Thriller/Suspense, Western
* **Description:** A bar chart showing the distribution of movies across different genres.
* **Trend of Most Popular Genres Over the Years**
* **Type:** Line Chart
* **X-axis:** (Implied: Time/Years)
* **Y-axis:** Number of Movies (0 to 70)
* **Genres:** Action, Adventure, Black Comedy, Comedy, Concert/Performance, Documentary, Drama, Horror, Musical, Romantic Comedy, Thriller/Suspense, Western
* **Description:** A line chart showing the trend of movie popularity for different genres over time.
* **Scatter Plot of Production Budget vs. IMDB Rating by Genre**
* **Type:** Scatter Plot
* **X-axis:** Production Budget ($) (0 to 300,000,000)
* **Y-axis:** IMDB Rating (0 to 10)
* **Legend:**
* null
* Action
* Adventure
* Black Comedy
* Comedy
* Concert/Performance
* Documentary
* Drama
* Horror
* Comedy/Suspense
* **Annotation:** Movie Title: The Godfather, Budget: 7000000, IMDB Rating: 9.2, Genre: null
* **Description:** A scatter plot showing the relationship between production budget and IMDB rating for different genres.
**Section E: Behind the Scene: Unpacking Movie Box Office Performance**
* **Title:** Behind the Scene: Unpacking Movie Box Office Performance
* **Sub-sections:**
* Budget vs. US Gross
* US Gross of each genre
* Audience Ratings (marked as "Irrelevant")
* US Gross vs. Release month
* **Budget vs. US Gross**
* **Type:** Scatter Plot
* **X-axis:** Production Budget ($) (0 to 300,000,000)
* **Y-axis:** US Gross ($) (0 to 800,000,000)
* **Description:** A scatter plot showing the relationship between production budget and US gross earnings.
* **US Gross of each genre**
* **Type:** Bar Chart
* **X-axis:** Major Genre
* **Y-axis:** Average US Gross ($) (0 to 110,000,000)
* **Genres:** Action, Adventure, Comedy, Musical, Romantic Comedy, Horror, Drama, Concert/Performance, Western, Black Comedy, Documentary
* **Description:** A bar chart showing the average US gross earnings for different genres.
* **Audience Ratings**
* **Type:** Scatter Plot
* **X-axis:** Rotten Tomatoes Rating (0 to 100)
* **Y-axis:** IMDB Rating (0 to 10)
* **Description:** A scatter plot showing the relationship between Rotten Tomatoes rating and IMDB rating. Marked as "Irrelevant".
* **US Gross vs. Release month**
* **Type:** Line Chart
* **X-axis:** Release Month
* **Y-axis:** Mean of US Gross ($) (0 to 80,000,000)
* **Description:** A line chart showing the relationship between release month and mean US gross earnings.
### Detailed Analysis or ### Content Details
**Section A: Design Space Overview**
* The flowchart structure suggests a process or workflow with multiple decision points and paths.
* The branching structure indicates different options or variations within the design space.
**Section B: User Rating vs. Topic**
* This section is a conceptual layout, so there are no specific data points to extract.
* It suggests an intention to analyze the relationship between user ratings and different topics.
**Section C: Framing Success: Unpacking What Influences Movie Revenues**
* **Earning in US vs. worldwide:**
* The scatter plot shows a general trend of higher worldwide gross earnings compared to US gross earnings.
* Most data points are clustered near the origin, indicating that many movies have relatively low earnings.
* There are a few outliers with significantly higher earnings.
* **How release year and genre influence earning:**
* The area chart shows that cumulative box office earnings have generally increased over time.
* Certain genres, such as Action and Adventure, appear to have consistently high earnings.
* The "Year 2009" line is a vertical line, indicating a specific point of reference.
* **How budget and genre influence earning:**
* The heatmap shows that higher budget ranges tend to be associated with higher profitability.
* Certain genres, such as Comedy and Action, appear to be more profitable across different budget ranges.
* Some genres, such as Western, have lower profitability, especially at higher budget ranges.
**Section D: The Genre Spectrum: Exploring the Movie Genre Landscape**
* **Distribution of Movies by Genre:**
* The bar chart shows that Comedy has the highest number of movies, followed by Drama.
* Genres such as Musical and Western have relatively few movies.
* **Trend of Most Popular Genres Over the Years:**
* The line chart shows that the popularity of different genres has varied over time.
* Comedy and Action appear to be consistently popular genres.
* Some genres, such as Horror, have experienced periods of increased popularity.
* **Scatter Plot of Production Budget vs. IMDB Rating by Genre:**
* The scatter plot shows a weak positive correlation between production budget and IMDB rating.
* Movies with higher budgets tend to have slightly higher IMDB ratings, but there is significant variation.
* The annotation highlights "The Godfather" with a budget of $7,000,000 and an IMDB rating of 9.2.
**Section E: Behind the Scene: Unpacking Movie Box Office Performance**
* **Budget vs. US Gross:**
* The scatter plot shows a positive correlation between production budget and US gross earnings.
* Movies with higher budgets tend to have higher US gross earnings, but there is significant variation.
* **US Gross of each genre:**
* The bar chart shows that Action and Adventure genres have the highest average US gross earnings.
* Documentary and Black Comedy genres have relatively lower average US gross earnings.
* **Audience Ratings:**
* The scatter plot shows a positive correlation between Rotten Tomatoes rating and IMDB rating.
* Movies with higher Rotten Tomatoes ratings tend to have higher IMDB ratings.
* **US Gross vs. Release month:**
* The line chart shows that US gross earnings vary by release month.
* Some months, such as the summer months (June, July), tend to have higher US gross earnings.
### Key Observations
* There is a general trend of higher worldwide gross earnings compared to US gross earnings.
* Higher budget ranges tend to be associated with higher profitability.
* Comedy and Action genres are consistently popular and profitable.
* There is a positive correlation between production budget and US gross earnings.
* US gross earnings vary by release month.
### Interpretation
The data suggests that several factors influence movie success, including budget, genre, release year, and release month. Higher budgets tend to lead to higher gross earnings, and certain genres, such as Action and Comedy, are consistently popular and profitable. The timing of release also plays a role, with summer months generally yielding higher gross earnings. The relationship between audience ratings (Rotten Tomatoes and IMDB) is also positive, indicating that movies with higher critical acclaim tend to have higher audience ratings. The "Design Space Overview" suggests a complex decision-making process in movie production, while the "User Rating vs. Topic" section indicates an interest in exploring the relationship between user opinions and movie themes.
DECODING INTELLIGENCE...
EXPERT: nemotron-free VERSION 1
RUNTIME: free/nvidia/nemotron-nano-12b-v2-vl:free
INTEL_VERIFIED
## Infographic: Movie Industry Analysis Framework
### Overview
The image presents a multi-section technical document analyzing movie industry dynamics through data visualization. It combines flowcharts, scatter plots, bar charts, and line graphs to explore relationships between production budgets, earnings, genres, and audience reception. Sections A-E represent distinct analytical frameworks.
### Components/Axes
**Section A: Design Space Overview**
- Flowchart with 5 main flows (Flow 1-5) and sub-flows (1-1a, 2-1a, 3-1a, 4-2a, 5-3a, 5-4b)
- Components: Circles (flows), rectangles (sub-flows), connecting lines
- Labels: "Flow 1" to "Flow 5" with hierarchical sub-flow numbering
**Section B: Genre-User Rating Matrix**
- X-axis: User Rating (dropdown)
- Y-axis: Topic (dropdown)
- Elements: Profits, IMDb Rating, Genres (represented by document icons)
- Positioning: Matrix layout with 5 genre categories (1-5)
**Section C: Framing Success**
1. **Bar Chart**: US vs. Worldwide Earnings
- X-axis: Earnings Type (US Gross, Worldwide Gross)
- Y-axis: Earnings ($)
- Data: US Gross ~$1.2B, Worldwide Gross ~$3.5B
2. **Line Graph**: Release Year vs. Genre Influence
- X-axis: Year (2009-2020)
- Y-axis: Cumulative Earnings ($)
- Trend: Peak in 2015 ($20B), decline to $15B by 2020
3. **Heatmap**: Budget vs. Genre Influence
- Color scale: Red (high budget) to Blue (low budget)
- Notable: Action/Adventure shows highest budget density
4. **Scatter Plot**: Budget vs. IMDb Rating
- X-axis: Production Budget ($)
- Y-axis: IMDb Rating (0-10)
- Red X labeled "Irrelevant" at ($300M, 4.5)
**Section D: Genre Spectrum**
1. **Bar Chart**: Genre Distribution
- Genres: Action (450), Comedy (300), Drama (600), Horror (200), Romance (150)
- Y-axis: Number of Movies (0-800)
2. **Line Graph**: Genre Popularity Over Time
- X-axis: Year (2000-2020)
- Y-axis: Movie Count (0-80)
- Trend: Peak ~2010 (70 movies), decline to 40 by 2020
3. **Scatter Plot**: Budget vs. IMDb Rating
- Color gradient: Red (high budget) to Blue (low budget)
- Notable: High-budget films cluster at lower ratings
**Section E: No Workflow Analysis**
1. **Scatter Plot**: Budget vs. US Gross
- X-axis: Production Budget ($)
- Y-axis: US Gross ($)
- Data points: Blue dots showing weak correlation
2. **Bar Chart**: US Gross by Genre
- Genres: Action ($1.2B), Comedy ($800M), Drama ($950M), Horror ($600M)
3. **Scatter Plot**: Audience Ratings vs. Rotten Tomatoes
- X-axis: Rotten Tomatoes (0-100)
- Y-axis: Audience Rating (0-10)
- Blue dots show positive correlation
4. **Line Graph**: US Gross vs. Release Month
- X-axis: Month (Jan-Dec)
- Y-axis: US Gross ($)
- Trend: Peaks in March ($75M) and July ($90M)
### Key Observations
1. **Budget-Quality Disconnect**: High-budget films (red in heatmap) show lower IMDb ratings (red X at $300M budget, 4.5 rating)
2. **Genre Dominance**: Action/Adventure dominates both budget and earnings metrics
3. **Temporal Shifts**: Genre popularity peaked in 2010, with significant decline by 2020
4. **Release Timing**: March and July show highest US gross earnings
5. **Audience-Professional Alignment**: Positive correlation between audience ratings and Rotten Tomatoes scores
### Interpretation
The data reveals complex industry dynamics:
1. **Budget vs. Quality**: High production budgets don't guarantee critical success, evidenced by the "Irrelevant" outlier
2. **Genre Economics**: Action/Adventure dominates financially but shows declining popularity over time
3. **Release Strategy**: Summer months (March-July) correlate with highest earnings, suggesting strategic release planning
4. **Audience Consensus**: Strong alignment between professional (Rotten Tomatoes) and audience ratings indicates reliable critical consensus
5. **Market Saturation**: Despite high budgets, the scatter plots show no clear correlation between spending and returns, suggesting market unpredictability
The framework demonstrates how multiple factors (budget, genre, timing) interact to influence movie success, with notable exceptions challenging traditional assumptions about production investment and returns.
DECODING INTELLIGENCE...