## Thinking Process Diagram: Math Problem Solving
### Overview
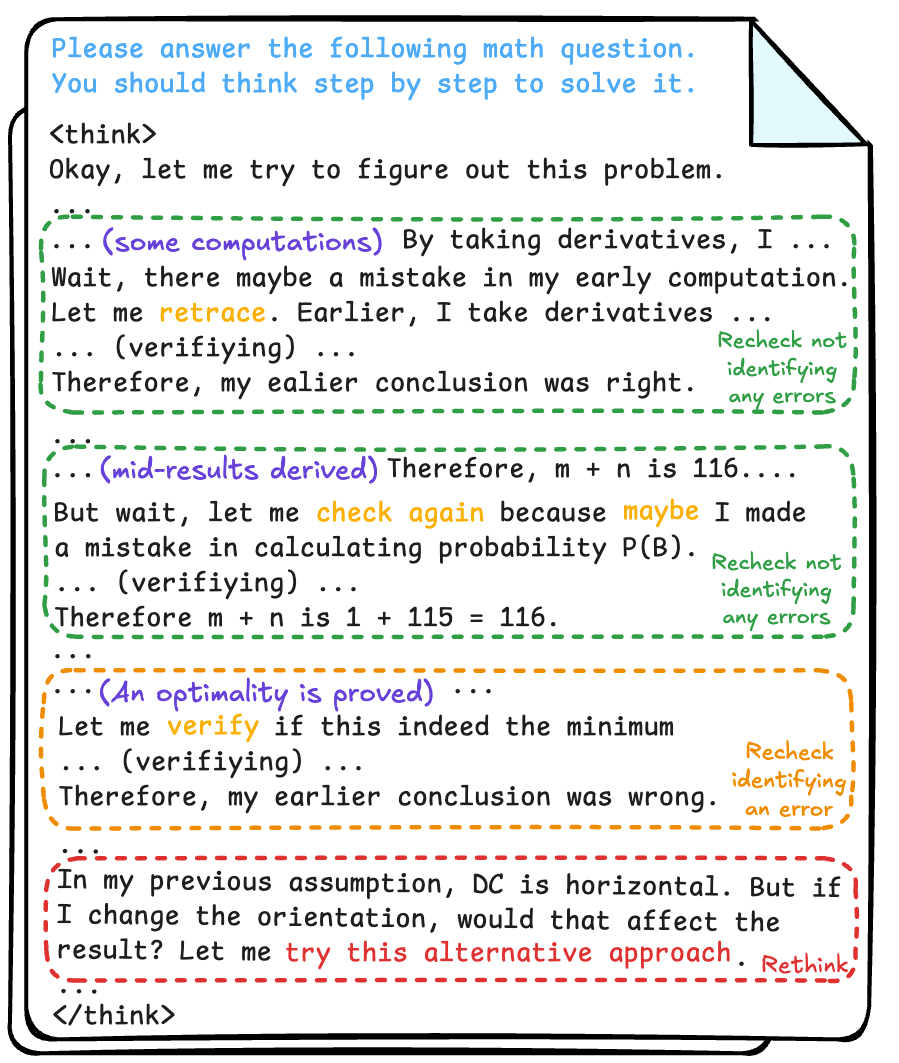
The image depicts a step-by-step thought process for solving a math problem. It shows the iterative nature of problem-solving, including initial attempts, error checking, and alternative approaches. The diagram uses color-coded boxes to represent different stages of thinking and actions.
### Components/Axes
* **Header:** "Please answer the following math question. You should think step by step to solve it."
* **Tags:** `<think>`, `</think>`
* **Green Boxes:** Represent initial computations, verifications, and conclusions.
* Dashed green lines.
* Text within:
* "...(some computations) By taking derivatives, I..."
* "Wait, there maybe a mistake in my early computation."
* "Let me retrace. Earlier, I take derivatives..."
* "...(verifying)..."
* "Therefore, my earlier conclusion was right."
* "...(mid-results derived) Therefore, m + n is 116...."
* "But wait, let me check again because maybe I made a mistake in calculating probability P(B)."
* "...(verifying)..."
* "Therefore m + n is 1 + 115 = 116."
* Right side of green boxes: "Recheck not identifying any errors"
* **Orange Box:** Represents an optimality check and a subsequent correction.
* Dashed orange lines.
* Text within:
* "...(An optimality is proved)..."
* "Let me verify if this indeed the minimum..."
* "...(verifying)..."
* "Therefore, my earlier conclusion was wrong."
* Right side of orange box: "Recheck identifying an error"
* **Red Box:** Represents a change in assumption and an alternative approach.
* Dashed red lines.
* Text within:
* "In my previous assumption, DC is horizontal. But if I change the orientation, would that affect the result? Let me try this alternative approach."
* Right side of red box: "Rethink"
* **Page Curl:** Top right corner of the page is folded over.
### Detailed Analysis or ### Content Details
The diagram starts with a prompt to answer a math question step-by-step. The initial approach involves computations and derivatives (green box). A potential mistake is identified, leading to retracing and verification. The conclusion is initially deemed correct.
Next, mid-results are derived, leading to the equation "m + n is 116". A check is performed due to a possible mistake in calculating probability P(B). The equation "m + n is 1 + 115 = 116" is then stated.
An optimality check (orange box) is performed to verify the minimum. The earlier conclusion is found to be wrong.
Finally, a change in assumption regarding the orientation of DC is considered (red box), leading to an alternative approach.
### Key Observations
* The diagram highlights the importance of error checking and verification in problem-solving.
* The use of different colored boxes emphasizes the different stages of the thought process.
* The iterative nature of problem-solving is evident, with multiple checks and corrections.
### Interpretation
The diagram illustrates a structured approach to solving a math problem. It demonstrates that problem-solving is not always a linear process but often involves backtracking, re-evaluation, and alternative approaches. The color-coding helps to visually distinguish between different stages of thinking, such as initial computations, error checking, and assumption changes. The diagram emphasizes the importance of critical thinking and the willingness to revise one's approach when necessary. The "Recheck" annotations reinforce the need for careful verification at each step.