## Line Chart: Qwen3-8B Performance Analysis
### Overview
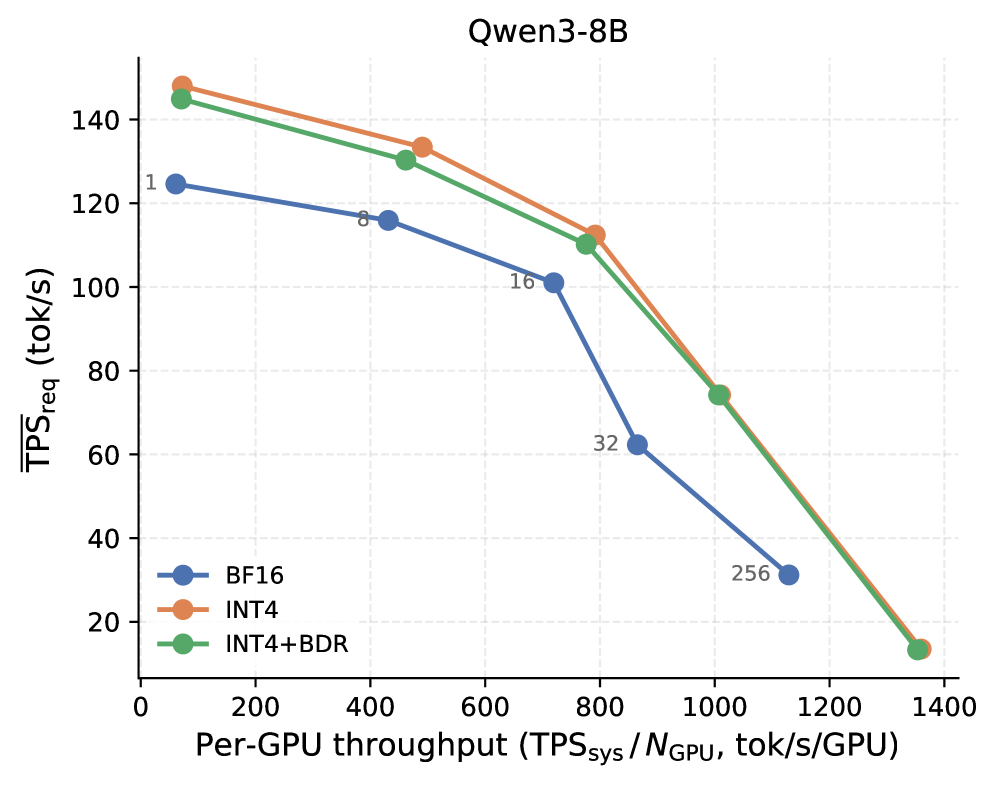
The chart compares the relationship between per-GPU throughput (x-axis) and required tokens per second (y-axis) for three configurations of the Qwen3-8B model: BF16, INT4, and INT4+BDR. All three lines show a downward trend, indicating that higher per-GPU throughput reduces the required TPS.
### Components/Axes
- **X-axis**: Per-GPU throughput (TPS_sys / N_GPU, tok/s/GPU)
- Scale: 0 to 1400 (logarithmic spacing implied by axis markers)
- Labels: 1, 8, 16, 32, 256, 1000, 1400
- **Y-axis**: TPS_req (tok/s)
- Scale: 0 to 160 (linear increments of 20)
- Labels: 20, 40, 60, 80, 100, 120, 140
- **Legend**:
- **BF16**: Blue line with circular markers
- **INT4**: Orange line with circular markers
- **INT4+BDR**: Green line with circular markers
- **Placement**: Legend is positioned in the bottom-left corner, aligned with the x-axis.
### Detailed Analysis
1. **BF16 (Blue Line)**
- Data Points:
- (1, 120)
- (8, 110)
- (16, 100)
- (32, 60)
- (256, 30)
- Trend: Gradual decline with a steep drop between 16 and 32.
2. **INT4 (Orange Line)**
- Data Points:
- (1, 150)
- (8, 135)
- (16, 120)
- (32, 90)
- (256, 45)
- (1000, 75)
- (1400, 15)
- Trend: Steeper initial decline than BF16, with a sharp drop at 1000 and 1400.
3. **INT4+BDR (Green Line)**
- Data Points:
- (1, 145)
- (8, 130)
- (16, 115)
- (32, 85)
- (256, 40)
- (1000, 70)
- (1400, 15)
- Trend: Similar to INT4 but slightly lower TPS_req across most ranges.
### Key Observations
- **Convergence at High Throughput**: All three lines converge near (1400, 15), suggesting diminishing returns in efficiency gains beyond this point.
- **INT4 vs. BF16**: INT4 consistently outperforms BF16 at higher throughputs (e.g., 256: 45 vs. 30 tok/s).
- **INT4+BDR Efficiency**: Outperforms both BF16 and INT4 at most throughput levels, with the largest gap at 1000 (70 vs. 75 tok/s for INT4).
- **BF16 Plateau**: BF16’s TPS_req stabilizes at 30 tok/s after 256 throughput, while INT4 and INT4+BDR continue declining.
### Interpretation
The chart demonstrates that **INT4+BDR** achieves the highest efficiency (lowest TPS_req) across most throughput ranges, followed by INT4 and then BF16. The convergence at 1400 throughput suggests that all configurations reach a similar performance ceiling, likely due to hardware or algorithmic limitations.
- **Practical Implications**:
- For high-throughput scenarios (>256), INT4+BDR is optimal.
- BF16 may be preferable for low-throughput applications where memory or precision is prioritized over speed.
- **Anomalies**:
- The sharp drop in INT4 and INT4+BDR at 1000 throughput (from 45 to 75 and 40 to 70, respectively) may indicate a transition between hardware layers or optimization thresholds.
- BF16’s plateau at 30 tok/s could reflect fixed memory constraints or quantization limits.
This analysis highlights trade-offs between precision (BF16), quantization (INT4), and memory optimization (INT4+BDR) in deploying large language models like Qwen3-8B.