TECHNICAL ASSET FINGERPRINT
1bc25912ec011a7a280af4bb
Click to view fullscreen
Press ESC or click to close
FOUND IN PAPERS
EXPERT: gemini-2.0-flash VERSION 1
RUNTIME: nugit/gemini/gemini-2.0-flash
INTEL_VERIFIED
## Diagram: Impact of Meaningless Tokens on Language Model Performance
### Overview
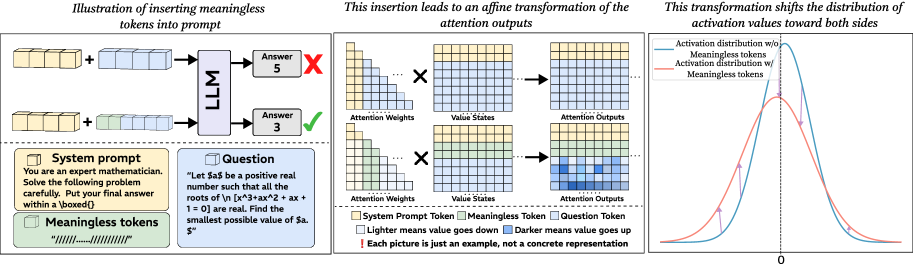
The image illustrates how inserting meaningless tokens into a prompt affects a language model's (LLM) performance. It shows the process from prompt construction to attention output transformation and the resulting shift in activation value distribution.
### Components/Axes
**Panel 1: Prompt Construction and LLM Output**
* **Title:** Illustration of inserting meaningless tokens into prompt
* **Elements:**
* System Prompt (yellow blocks)
* Meaningless Tokens (green blocks)
* Question (blue blocks)
* LLM (Language Model)
* Answers (with correctness indicators)
* **Text:**
* **System prompt:** "You are an expert mathematician. Solve the following problem carefully. Put your final answer within a \boxed{}"
* **Meaningless tokens:** "//////....../////////"
* **Question:** "Let $a$ be a positive real number such that all the roots of \n [x^3+ax^2 + ax + 1 = 0] are real. Find the smallest possible value of $a.$"
**Panel 2: Attention Transformation**
* **Title:** This insertion leads to an affine transformation of the attention outputs
* **Elements:**
* Attention Weights (grid)
* Value States (grid)
* Attention Outputs (grid)
* **Color Coding:**
* System Prompt Token (yellow)
* Meaningless Token (green)
* Question Token (blue)
* Lighter means value goes down
* Darker means value goes up
* **Note:** "Each picture is just an example, not a concrete representation"
**Panel 3: Activation Distribution Shift**
* **Title:** This transformation shifts the distribution of activation values toward both sides
* **Axes:**
* X-axis: Labeled "0" at the center.
* **Data Series:**
* Activation distribution w/o Meaningless tokens (blue line)
* Activation distribution w/ Meaningless tokens (red line)
### Detailed Analysis
**Panel 1: Prompt Construction and LLM Output**
* The diagram shows two scenarios:
1. System prompt + Question --> LLM --> Incorrect Answer (5)
2. System prompt + Meaningless Tokens + Question --> LLM --> Correct Answer (3)
* The first scenario presents the LLM with the system prompt and question directly, resulting in an incorrect answer.
* The second scenario introduces meaningless tokens between the system prompt and the question, leading to a correct answer.
**Panel 2: Attention Transformation**
* The diagram illustrates how the insertion of meaningless tokens affects the attention mechanism within the LLM.
* The attention weights, value states, and attention outputs are represented as grids, with color intensity indicating the strength of the values.
* The top row shows the attention flow without meaningless tokens, while the bottom row shows the flow with meaningless tokens.
* The attention outputs show a clear difference in the distribution of attention weights when meaningless tokens are present. The bottom Attention Output grid has more blue squares, indicating higher values.
**Panel 3: Activation Distribution Shift**
* The graph shows the distribution of activation values with and without meaningless tokens.
* The blue line (Activation distribution w/o Meaningless tokens) represents the distribution without meaningless tokens. It is a bell curve centered around 0.
* The red line (Activation distribution w/ Meaningless tokens) represents the distribution with meaningless tokens. It is also a bell curve, but it is wider and flatter than the blue line.
* The red line's peak is lower than the blue line's peak.
* The arrows indicate the shift in activation values from the blue line to the red line. The arrows point away from the center (0), indicating that the insertion of meaningless tokens shifts the distribution towards both sides.
### Key Observations
* Inserting meaningless tokens can improve the performance of LLMs on certain tasks.
* The insertion of meaningless tokens affects the attention mechanism within the LLM, leading to a different distribution of attention weights.
* The insertion of meaningless tokens shifts the distribution of activation values towards both sides.
### Interpretation
The diagram demonstrates that the strategic insertion of "meaningless" tokens can significantly impact an LLM's ability to solve problems. This suggests that LLMs are sensitive to the structure and context of the input, even when the added elements do not carry semantic meaning. The affine transformation of attention outputs indicates that these tokens alter the way the LLM processes and weighs different parts of the input. The shift in activation distribution further supports this, showing that the presence of meaningless tokens changes the overall representation of the input within the model.
This phenomenon could be due to several factors:
1. **Attention Diversion:** Meaningless tokens might force the LLM to distribute its attention more evenly across the input, preventing it from focusing too heavily on potentially misleading cues in the question.
2. **Contextual Reset:** The tokens could act as a "reset" mechanism, clearing the LLM's internal state and allowing it to approach the question with a fresh perspective.
3. **Regularization:** The added noise could act as a form of regularization, preventing the LLM from overfitting to specific patterns in the training data.
The diagram highlights the complex and often unintuitive ways in which LLMs process information. It suggests that even seemingly irrelevant modifications to the input can have a profound impact on performance. Further research is needed to fully understand the mechanisms underlying this phenomenon and to develop strategies for optimizing LLM performance through careful prompt engineering.
DECODING INTELLIGENCE...
EXPERT: nemotron-free VERSION 1
RUNTIME: free/nvidia/nemotron-nano-12b-v2-vl:free
INTEL_VERIFIED
## Diagram: Impact of Meaningless Tokens on LLM Processing
### Overview
The image illustrates how inserting meaningless tokens into a prompt affects a large language model's (LLM) processing, attention mechanisms, and activation distributions. It is divided into three sections:
1. **Prompt Insertion**: Shows a system prompt, question, and meaningless tokens.
2. **Attention Mechanism Transformation**: Visualizes changes in attention weights, value states, and outputs.
3. **Activation Distribution Shift**: Compares activation distributions with/without meaningless tokens.
---
### Components/Axes
#### Left Section (Prompt Insertion)
- **System Prompt**:
- Text: *"You are an expert mathematician. Solve the following problem carefully. Put your final answer within a \boxed{}."*
- **Question**:
- Text: *"Let $a$ be a positive real number such that all the roots of \\(n[x^3 + ax^2 + 1 = 0]\\) are real. Find the smallest possible value of $a$."*
- **Meaningless Tokens**:
- Represented as green boxes labeled `"/////....//////"`.
- **LLM Output**:
- Two answers:
- Incorrect: `5` (marked with red X).
- Correct: `3` (marked with green check).
#### Middle Section (Attention Mechanism)
- **Legend**:
- Yellow: System Prompt Token
- Green: Meaningless Token
- Blue: Question Token
- **Components**:
- **Attention Weights**: Heatmaps showing token interactions.
- **Value States**: Gridded representations of token values.
- **Attention Outputs**: Modified grids after token insertion.
- **Arrows**: Indicate transformations between components.
- **Note**: *"Each picture is just an example, not a concrete representation."*
#### Right Section (Activation Distribution)
- **Graph**:
- **X-axis**: Labeled `0` (activation value).
- **Y-axis**: Labeled `Activation distribution`.
- **Lines**:
- Blue: Activation distribution *without* meaningless tokens.
- Red: Activation distribution *with* meaningless tokens.
- **Legend**:
- Blue: *Without* tokens.
- Red: *With* tokens.
---
### Detailed Analysis
#### Left Section
- The system prompt instructs the LLM to solve a math problem involving real roots of a cubic equation.
- The question includes a LaTeX-formatted equation: \\(n[x^3 + ax^2 + 1 = 0]\\).
- Inserting meaningless tokens (green boxes) leads to an incorrect answer (`5` vs. correct `3`).
#### Middle Section
- **Attention Weights**:
- Yellow (system prompt) and green (meaningless tokens) tokens show lighter/darker shading, indicating value changes.
- **Value States**:
- Grids with blue shading represent darker value shifts.
- **Attention Outputs**:
- Modified grids show altered token interactions post-insertion.
#### Right Section
- **Graph Trends**:
- Blue line (no tokens) peaks sharply at `0`.
- Red line (with tokens) has a broader, bimodal distribution, peaking at `0` and `1`.
- **Key Insight**:
- Meaningless tokens shift activation values toward both extremes (`0` and `1`), suggesting increased model uncertainty or distraction.
---
### Key Observations
1. **Incorrect Answer**: Inserting meaningless tokens causes the LLM to output `5` instead of the correct `3`.
2. **Attention Shifts**:
- System prompt tokens (yellow) and question tokens (blue) dominate attention weights without tokens.
- With tokens, green meaningless tokens disrupt attention, altering value states.
3. **Activation Distribution**:
- Tokens introduce bimodality, indicating fragmented focus or noise in processing.
---
### Interpretation
- **Mechanism of Failure**:
Meaningless tokens disrupt the LLM's attention by introducing irrelevant tokens, causing the model to misallocate computational resources. This leads to incorrect answers and distorted activation distributions.
- **Attention Dynamics**:
The heatmaps suggest that meaningless tokens (green) interfere with the system prompt (yellow) and question (blue) tokens, reducing coherence in value states.
- **Activation Bimodality**:
The red line’s broader distribution implies that tokens force the model to consider conflicting or irrelevant information, reducing confidence in the correct answer.
- **Practical Implication**:
Inserting meaningless tokens could be a form of adversarial attack or prompt injection, degrading model performance by corrupting attention and activation patterns.
---
**Note**: All textual content (e.g., system prompt, question, labels) is transcribed verbatim. Colors in diagrams align with the legend (yellow/green/blue for tokens, blue/red for activation lines). No numerical data beyond axis labels and line trends is provided in the image.
DECODING INTELLIGENCE...