TECHNICAL ASSET FINGERPRINT
1bc25912ec011a7a280af4bb
Click to view fullscreen
Press ESC or click to close
FOUND IN PAPERS
EXPERT: healer-alpha-free VERSION 1
RUNTIME: free/openrouter/healer-alpha
INTEL_VERIFIED
## Technical Diagram: Mechanism of Meaningless Token Insertion in LLM Prompts
### Overview
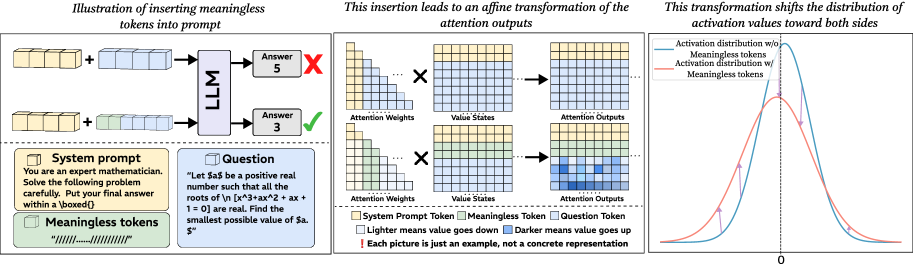
This technical diagram illustrates a hypothesized mechanism by which inserting meaningless tokens into a prompt for a Large Language Model (LLM) can alter its output, potentially improving accuracy on specific tasks. The diagram is divided into three connected panels that describe the process from prompt modification to its effect on the model's internal attention mechanism and activation distributions.
### Components/Axes
The diagram consists of three main panels arranged horizontally.
**1. Left Panel: "Illustration of inserting meaningless tokens into prompt"**
* **Visual Components:** Two parallel process flows.
* **Top Flow (Baseline):** A yellow block labeled "System prompt" is combined with a blue block labeled "Question". An arrow points to a box labeled "LLM". The output is "Answer 5" with a red "X" (indicating incorrect).
* **Bottom Flow (Modified):** The same yellow "System prompt" block is combined with the blue "Question" block and a new green block labeled "Meaningless tokens" containing the text `"/\/\/\/\/\/\/\/\/\/"`. An arrow points to the same "LLM" box. The output is "Answer 3" with a green checkmark (indicating correct).
* **Text Content:**
* **System prompt box:** "You are an expert mathematician. Solve the following problem carefully. Put your final answer within a \boxed{}"
* **Question box:** "Let $a$ be a positive real number such that all the roots of the polynomial $ax^3 + x^2 + ax + 1 = 0$ are real. Find the smallest possible value of $a$."
* **Meaningless tokens box:** "/\/\/\/\/\/\/\/\/\/"
* **Legend (bottom left):** Explains the color coding: Yellow square = "System Prompt Token", Green square = "Meaningless Token", Blue square = "Question Token".
**2. Middle Panel: "This insertion leads to an affine transformation of the attention outputs"**
* **Visual Components:** A matrix multiplication diagram showing two rows.
* **Top Row (Baseline):** A matrix of "Attention Weights" (with yellow and blue cells) is multiplied (×) by a matrix of "Value States" (with yellow and blue cells). The result is a matrix of "Attention Outputs" (with yellow and blue cells).
* **Bottom Row (Modified):** The "Attention Weights" and "Value States" matrices now include green cells (for the meaningless tokens). The resulting "Attention Outputs" matrix shows a visible change in cell shading compared to the top row.
* **Legend (bottom center):** Repeats the color coding. Adds: "Lighter means value goes down", "Darker means value goes up", "[Each picture is just an example, not a concrete representation]".
**3. Right Panel: "This transformation shifts the distribution of activation values toward both sides"**
* **Visual Components:** A 2D line graph.
* **X-axis:** Unlabeled, but a vertical dashed line is drawn at "0".
* **Y-axis:** Unlabeled, representing frequency or density.
* **Data Series:**
* **Blue Curve:** Labeled "Activation distribution w/o Meaningless tokens". It is a tall, narrow bell curve centered on the 0 line.
* **Red Curve:** Labeled "Activation distribution w/ Meaningless tokens". It is a shorter, wider bell curve that is shifted slightly to the left and right, indicating a broader spread of values away from zero.
* **Legend:** Integrated directly into the graph lines.
### Detailed Analysis
* **Process Flow:** The diagram proposes a causal chain: 1) Insertion of meaningless tokens → 2) Affine transformation of attention outputs → 3) Shift in the distribution of activation values → 4) Change in final model output (from incorrect to correct answer).
* **Attention Mechanism Effect:** The middle panel visually suggests that the inclusion of meaningless tokens (green) in the attention calculation alters the resulting "Attention Outputs" matrix. The note "Darker means value goes up" implies the transformation may amplify or modulate certain signals within the model's processing.
* **Activation Distribution Shift:** The right panel's graph is the key quantitative claim. The baseline (blue) distribution is highly concentrated around zero. The modified (red) distribution is "shifted... toward both sides," meaning the activation values become more dispersed, with more values having larger positive or negative magnitudes.
### Key Observations
1. **Task-Specific Benefit:** The example uses a specific, complex math problem. The implication is that this technique may be particularly useful for tasks requiring precise reasoning or exploration of a solution space.
2. **Non-Semantic Intervention:** The tokens are explicitly "meaningless" (`/\/\/...`), indicating the effect is not due to adding relevant information but to altering the model's internal computational dynamics.
3. **Visual Metaphor for "Jitter" or "Noise":** The shift from a narrow to a broad activation distribution is a common metaphor in machine learning for introducing noise to escape local minima or encourage exploration. This diagram suggests a method to induce such a shift at the attention layer.
### Interpretation
This diagram presents a theory for why a seemingly nonsensical prompt engineering tactic—appending garbage tokens—can sometimes improve LLM performance. It argues that the tokens are not processed for their meaning but act as a **computational catalyst**.
The proposed mechanism is twofold:
1. **Attention Modulation:** The meaningless tokens participate in the attention mechanism, creating an "affine transformation" (a linear transformation plus a translation) of the value states. This could function like a learned skip connection or a dynamic scaling factor, subtly reweighting the importance of different parts of the prompt.
2. **Activation Redistribution:** The ultimate effect is to push the model's internal activations away from a tight cluster around zero. In optimization terms, a narrow distribution might represent a "confident" but potentially suboptimal state. Broadening the distribution could force the model to consider a wider range of numerical pathways, potentially helping it escape a local minimum in its reasoning process and find a more accurate solution (Answer 3 vs. Answer 5).
The diagram serves as a conceptual bridge between a simple, observable prompt hack and a complex internal change in the model's behavior, framing it as a deliberate intervention in the model's information processing flow rather than a random artifact.
DECODING INTELLIGENCE...