## Line Chart: Head Influence Curves (Qwen3-4B)
### Overview
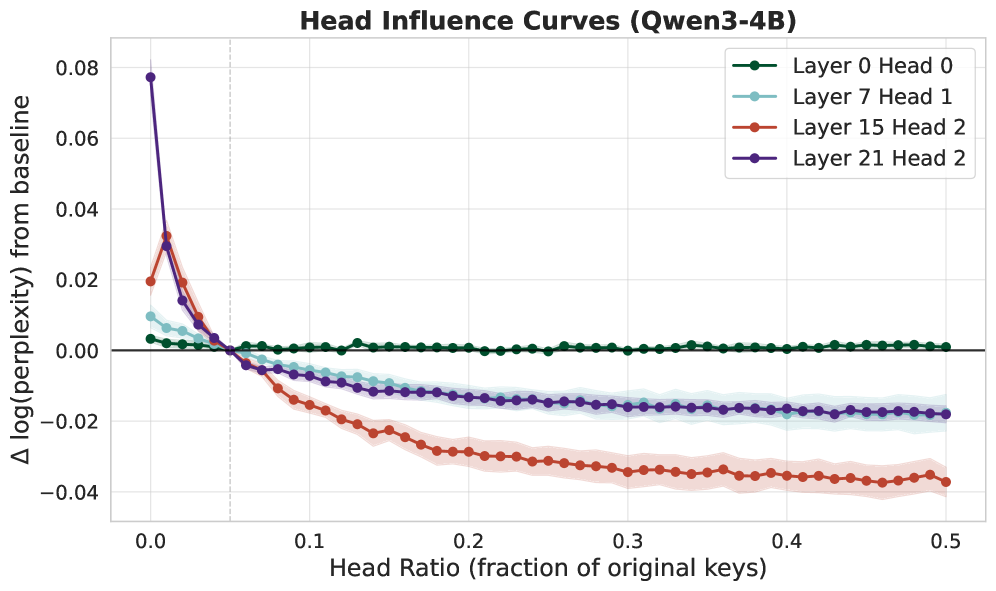
The chart visualizes the change in perplexity (Δ log(perplexity)) relative to a baseline as a function of "Head Ratio" (fraction of original keys retained). Four data series represent different layer-head combinations, with shaded regions indicating confidence intervals.
### Components/Axes
- **X-axis**: Head Ratio (fraction of original keys), ranging from 0.0 to 0.5 in increments of 0.1.
- **Y-axis**: Δ log(perplexity) from baseline, ranging from -0.04 to 0.08.
- **Legend**: Located in the top-right corner, mapping colors to layer-head pairs:
- Green: Layer 0 Head 0
- Light Blue: Layer 7 Head 1
- Red: Layer 15 Head 2
- Purple: Layer 21 Head 2
### Detailed Analysis
1. **Layer 0 Head 0 (Green)**:
- Remains nearly flat at ~0.0 across all Head Ratios.
- Confidence interval is tightly clustered (~±0.002).
2. **Layer 7 Head 1 (Light Blue)**:
- Starts at ~0.015 at Head Ratio 0.0, dips to ~-0.01 at 0.1, then stabilizes near -0.005.
- Confidence interval widens slightly at lower Head Ratios.
3. **Layer 15 Head 2 (Red)**:
- Peaks at ~0.035 at Head Ratio 0.0, drops sharply to ~-0.03 by 0.1, then stabilizes near -0.025.
- Confidence interval is broadest at Head Ratio 0.0 (~±0.015).
4. **Layer 21 Head 2 (Purple)**:
- Sharp peak at ~0.08 at Head Ratio 0.0, plunges to ~-0.01 by 0.1, then stabilizes near -0.005.
- Confidence interval is narrowest at Head Ratio 0.0 (~±0.005).
### Key Observations
- **Layer 21 Head 2** exhibits the most dramatic change, with a 0.09 drop in Δ log(perplexity) from 0.0 to 0.1 Head Ratio.
- **Layer 0 Head 0** shows minimal sensitivity to Head Ratio changes.
- **Layer 15 Head 2** and **Layer 21 Head 2** have the largest confidence intervals at Head Ratio 0.0, suggesting higher variability in measurements.
- All lines except Layer 0 Head 0 trend downward as Head Ratio increases.
### Interpretation
The data suggests that reducing the number of keys (Head Ratio < 1.0) generally decreases perplexity (improves model performance) for most layers, with higher layers (e.g., Layer 21) showing stronger effects. The stability of Layer 0 Head 0 implies it is less critical for perplexity. The sharp initial drops for Layers 15 and 21 indicate that key retention has a disproportionate impact in early stages. Confidence intervals highlight measurement uncertainty, particularly for Layer 15 Head 2 at Head Ratio 0.0. This could reflect architectural sensitivity in deeper layers or variability in key importance across attention heads.